
Product Requirement Document: Treatment Quality Monitoring (TQM)
Introduction
The waste value chain has 5 main stages:
Generation
Containment
Transport
Treatment
Reuse
For effective waste management, all of these stages need to be focused on. For example, improper containment of Faecal Sludge can lead to percolation of chemicals into the groundwater and its contamination, or ineffective transportation management can lead to waste being dumped illegally into surface water or land. Similarly, an essential part of effective waste management is the proper treatment of Waste.
Ineffective treatment of waste and its discharge into the environment has a direct adverse impact on the environment and water quality. Effluents are often discharged into surface water sources. The poor quality of wastewater effluents is responsible for the degradation of the receiving surface water body and the health of its users.
Quality and re-use have a direct relationship: Treated waste output can be reused, be it recycled water or as compost. Acceptance of this by consumers will largely depend on its quality and the value it provides. Nobody wants water in their flush that stinks, or manure that does not fertilise plants enough.
Currently, there is little to no visibility of how waste is being handled and treated at the treatment plant. Keeping this in mind, a Treatment Quality Monitoring (TQM) will be introduced as an extension to DIGIT Sanitation.
Objective
The objective is to improve the quality of treated waste
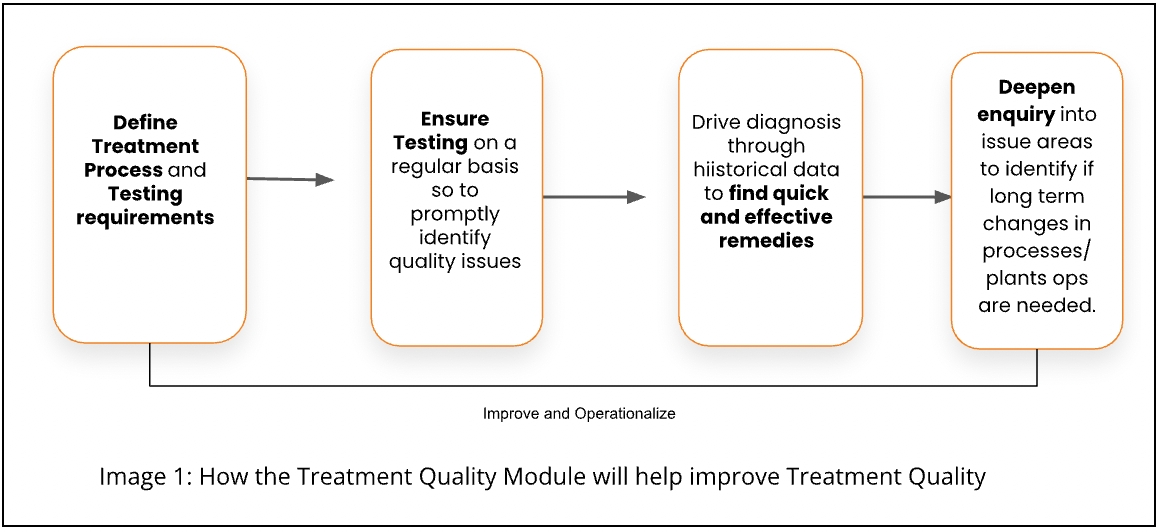
Our hypothesis of how treatment quality can be improved is as follows:
Define Treatment Processes and Testing Requirements: Mapping of plants and treatment processes will allow for a consolidated view to the state/TSUs/stakeholders of the treatment processes operational at plants. Additionally, this will allow for the definition of treatment requirements, frequencies and benchmarks at the state level for various processes and its adoption by plants. This further allows for analysis at the process level of treatment quality, and provides insights for improvements overtime.
Ensure Regular Testing: Operationalising regular and high-frequency testing will allow for the detection of deviations from benchmarks at the earliest.
Quick Issue Resolution: Identification of deviations and its diagnosis via an analysis of current and historical data will allow for quick issue resolution.
Deepen Enquiry: Is a particular plant consistently performing badly? Is a particular treatment process regularly leading to poor quality output? Which step in the process flow is the deviation starting from? Do quality test results fluctuate often? Looking at trends in data can help deepen enquiry and identify problem areas.
Improvement in processes or a need for further enquiry can be operationalised by redefining treatment processes and testing requirements.
Definitions
Plant
A facility that takes raw materials as inputs and converts them into a set out expected outputs through a series of setup processes and with the use of equipment operated by people.
Treatment Process
Sequential series of steps required to translate input to output.
Stages
Each step within the treatment Process. Each job may have one or many input quality parameters and one or many output quality parameters.
Assets
Physical infrastructure required to execute a job in a treatment Process
Parameters
Criteria used to measure input and output for a job. Each parameter will have a unit of measurement.
Frequency
The duration of time between two subsequent tests
Benchmarks
Acceptable value ranges for each parameter
Testing Standards
A combination of a Parameter, acceptable benchmark of the parameter and its frequency of testing. For example, ph >= 7 tested weekly
Success Criteria
Goal
Category
Objective
How will it be measured via the product
How will we know TQM is successful
Zero deaths, diseases, and environmental contamination resulting from poor sanitation
Primary
To ensure treated waste is as per the quality standards
The percentage of plants with output quality is as per benchmarks
Increase in the percentage of plants with output quality as per benchmarks over time
Zero deaths, diseases, and environmental contamination resulting from poor sanitation
Secondary
To ensure treated waste is tested regularly for quick identification of issues
The percentage compliance against testing schedule
Increase in the percentage compliance against testing schedule over time
Design Guidelines
1
The TQM module should be configurable for multiple waste streams such as faecal sludge, solid waste, medical waste, waste water etc.
2
The TQM module should be usable by itself without the need to set up/deploy the rest of the DIGIT FSM modules
3
In the design of DIGIT Sanitation v1.3, treatment plant operators are employees of a ULB
Based on our learnings, treatment plants can be managed by:
Self-help groups (as in the case of Orissa and Trichy, Tamil Nadu). In such a case, a member of the SHG performs the role of a treatment plant operator.
Direct employees of the ULB (as in the case of some plants in Tamil Nadu).
Vendors who were outsourced on a build and manage model.
Which requires the capability to enable vendors and individuals to be able to manage the operations, access and use the system.
4
Currently, in the product, there is a 1-to-1 mapping between ULBs and plants. The TQM module should allow for tagging as per the following: Many plant - 1 boundary 1 boundary - 1 plant Multiple boundaries - 1 plant
4
There are multiple operating models when it comes to lab testing and O&M of a treatment plant. Roles in the system need to be defined to support various operating models.
Case 1:
The treatment quality workflow defined in the PRD has two steps:
Submission of sample to a lab
Uploading test results
In the case of Orissa, where labs for testing the quality of treated waste are in-house, both these workflow steps are performed by the same person. However, in Tamil Nadu, testing is outsourced to a central lab for 3 or 4 plants. In this case, the functionality to record test results will be provided to the labs.
Proposed Solution
Given the objective to improve quality of treated waste and the steps required to achieve it, the following are needed at each stage:
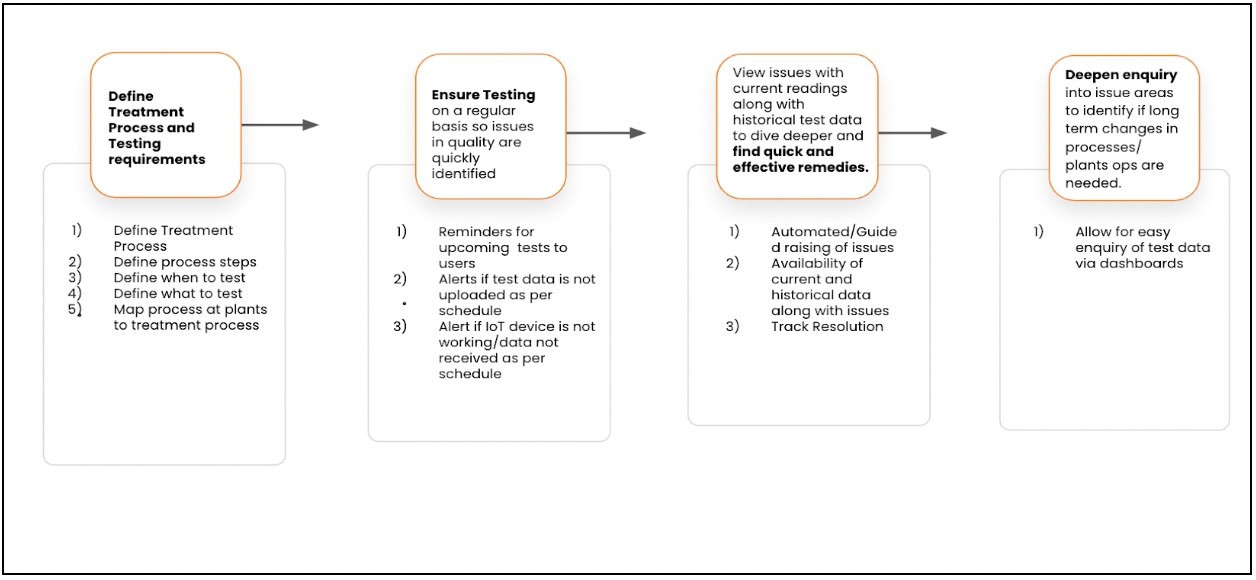
Keeping this in mind, the following components will be available in the TQM module:
Components
Description
Functionality
Schedule of Tests
This component will be used by treatment plant operators and ULB employees to see the schedule of tests
View schedule of Lab tests and track compliance.
Track compliance of IoT test results and cases of failures.
Recording Test Results
This component will be used by treatment plant operators and ULB employees to upload results manually and track IoT readings
Create digital records of quality test results
Alerts in the following cases:
IoT device not working
Lab results do not match IoT results
Anomaly Detection
This component will be used by treatment plant operators and ULB employees to interpret test results
Identify in real-time/near real time when results of a particular test are not as per benchmarks.
Alerts in the following cases:
Results not upto benchmark
Dashboards
This module will give stakeholders insights and information regarding operations of the treatment plant. Users can use this to drill down and identify plants and processes where compliance to testing and/or test results are not upto benchmarks.
Dashboards will also help users see trends over time to see patterns and identify long-term problem areas.
Dashboard to analyse trends in treatment quality and compliance with treatment schedule. Drill-down will be made available from state to ULB and to a plant level.
Dashboard to analyse patterns in issues. Drill-down will be made available from state to ULB and to a plant level.
The aim of the modules is to provide the users of the system information and control at each level - from defining how operations will be run, to updating status against pending operational tasks and viewing operational data to draw insights to refine operations.
What is the value being generated?
Through the above, we are looking to address the following challenges:
Category
Challenge
How will the product address?
Informational
No knowledge of treatment and disposal processes
Awareness on when waste has to be tested and for which parameters.
Changing Standards for treated waste
Operationalising changing standards of waste by configuring additional parameters/frequency for testing.
Operational
No record keeping of waste quality
Record and maintain digital records of treatment quality.
No mechanism to monitor
treatment Plant operators
Track and measure compliance against testing schedule.
No clear definitions of responsibilities for the ULB
Setup via roles who are responsible for quality testing and issue resolution.
The following value will be created for users:
User
Value Bundle
State administration/Pollution control board/Stakeholders (DDWS, WATSAN boards, WATCO etc)
Ease of monitoring treatment quality, treatment quality trends and detect variations across plants.
Ease of monitoring and ensuring compliance to quality treatment schedule across plants.
Ability to change testing parameters and frequency basis test results across plants/for a particular plant.
Urban local body
Ease of monitoring treatment quality and treatment quality trends and detect variations.
Ease of monitoring and ensuring compliance to quality treatment schedule.
Centralised view of issues across plants.
Ability to change testing and maintenance frequency basis test results.
Treatment plant operators/Vendors managing treatment plants
Timely reminders to perform testing.
Ease of sharing records with ULB/stakeholders.
Scope
Treatment Quality Monitoring Workflow
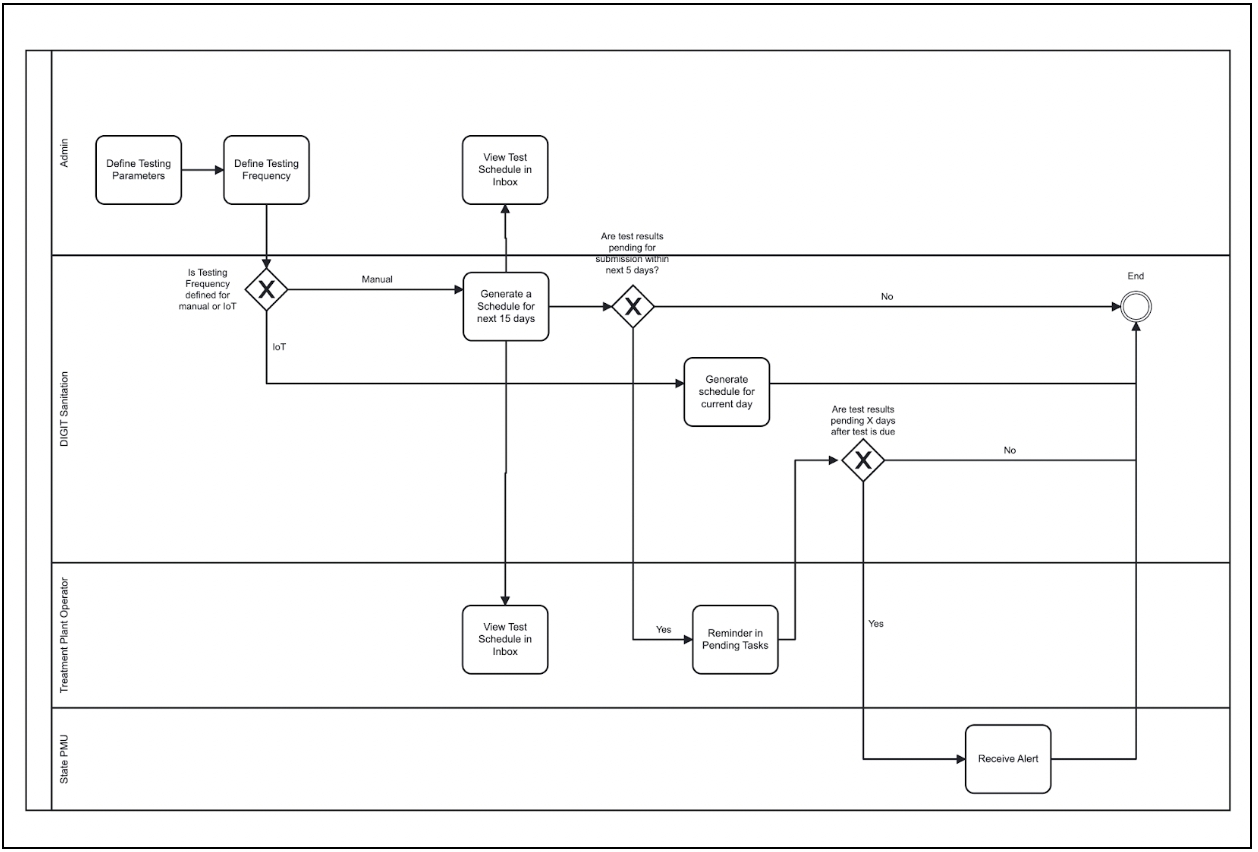
The objective of the treatment quality module is to allow data observability of the parameters of treatment quality to improve the performance of the treatment plant. There are two ways to capture data:
Manual input.
Automated capture of test results via configured IoT sensors. While the use of sensors reduces manual intervention in the process, the availability of infrastructure on the ground is a challenge.
Once the initial setup is done, the following image illustrates how the system will be used to monitor treatment quality:
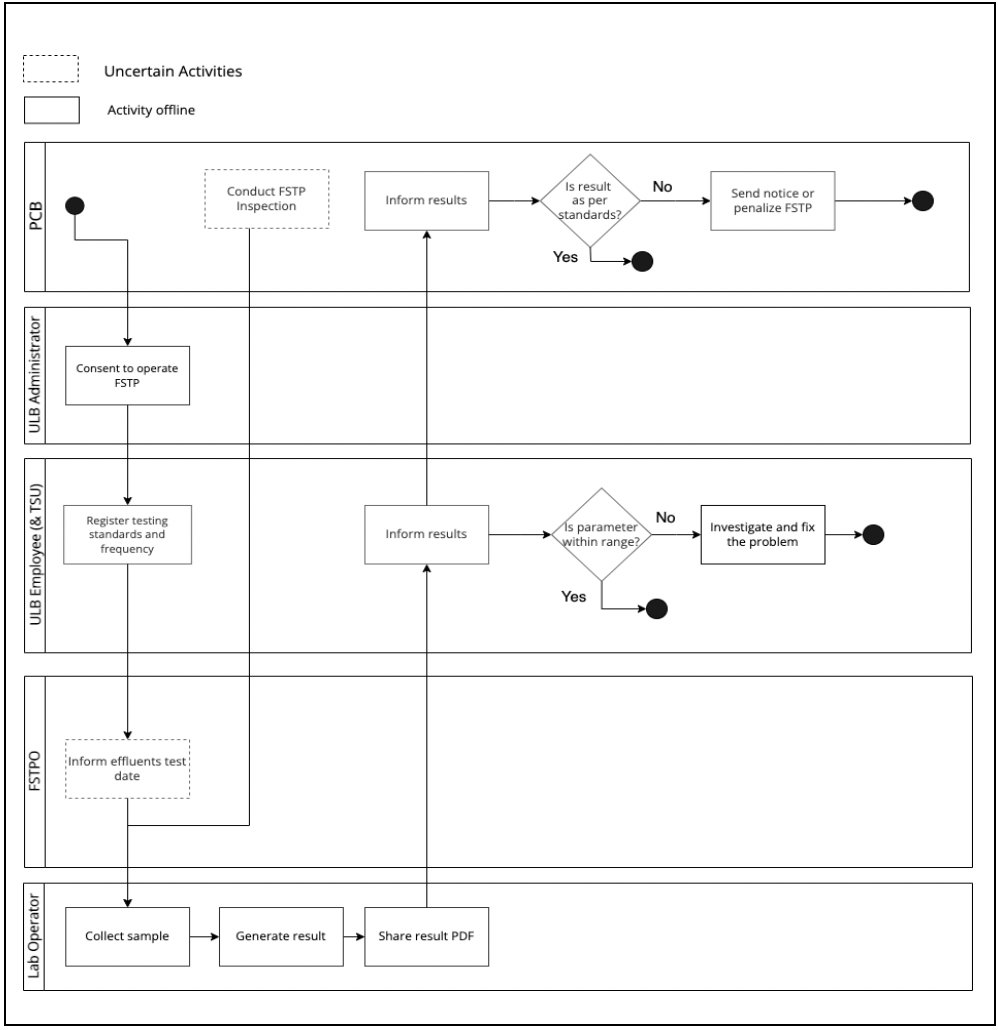
Identified gaps:
Irregularity in laboratory testing.
Unavailability of actionable information on quality.
The flow will be as follows:
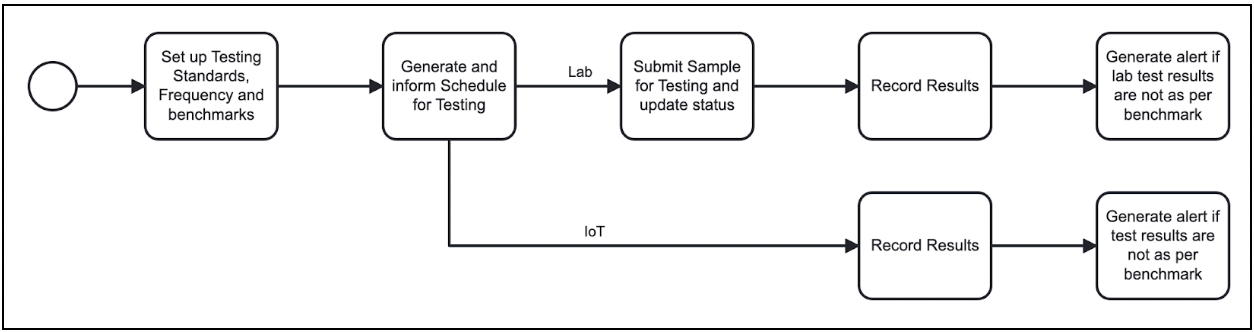
The scope of the Treatment Quality Module is as follows:
Register Testing Standards
A plant may have one or multiple treatment processes. For example:
An FSTP is dedicated to the treatment of faecal sludge such as the aerobic treatment process.
A co-treatment plant has two treatment processes: Faecal sludge and septage together.
A treatment process has multiple stages/steps. In case of a plant with multiple processes, stages may converge.
Define input/output quality testing requirements:
Each stage may have multiple input types and output types (for example, effluents and biosolids), and each stage may need to have the input and output quality tested for each of the input and output types.
The state and the ULB admin should be able to perform the following actions:
Define if one or many Input types needs to be tested for a particular stage.
Define if one or many output types need to be tested for a particular stage.
Enable/disable testing of a particular input/output type for a particular stage.
The UI screen for this should be enabled with the launch of workbench.
Define testing parameters, benchmarks and frequency:
Testing parameters and benchmarks are set at the national/state level and adhered to by plants. However. based on the geographical location, the benchmarks may vary.
Testing frequencies are set at the state level and adhered to by plants. These may be adjusted for plants, basis testing results.
Each output and input type will have one or more testing standards (parameters, benchmarks, and frequency). For example, for output type ‘effluent’, one may need to test PH (daily), BOD (weekly) and COD (weekly).
For a particular plant, testing will be done by one or multiple methods including:
- Manual testing in a lab
- Testing via IoT devices
The frequency of this will be different.
The state and the ULB admin should be able to perform the following actions:
Define one or multiple testing standards (parameter, benchmark, and frequency) at an instance level.
Edit testing Standards (parameter, benchmark, and frequency) for a plant.
Define different standards for manual and IoT-based testing for a particular input/output type for a stage.
This does not require a UI screen.
Generation of Schedule
Schedule for tests will be auto-generated for various parameters based on the frequency.
For manual tests, the schedule will be used to:
Display a list of upcoming tests to the plant operator and stakeholders.
Generation of alerts for upcoming tests.
Escalation in case of non-adherence to the test schedule.
For IoT tests, the schedule will be used to:
Generate alerts in case a reading is not received as per the schedule.
Workflow:
Generation of Schedule: For the generation of schedule of testing:
For manual testing:
a. For 1 particular stage of the treatment process:
Multiple parameters that have the same frequency to be combined to one test.
For parameters with different frequency, different tests should be created.
b. For 2 different stages of the treatment process:
The same parameter with the same frequency will be two different tests.
For IoT testing:
a. Multiple parameters captured by the same device will be a single test.
View Schedule:
The schedule will be available for view and action to the following users:
a. For Labs
ULB employee: [X] days prior to test date (Inbox). [X] here is configurable.
Treatment plant operator: [Y] days prior to test date (Inbox). [Y] here is configurable.
Treatment plant operator: [Z] days prior to test date (as a pending task in the UI). [Z] here is configurable.
Tests will continue to remain in the inbox/pending tasks list as long as test results are not submitted.
b. For IoT Testing:
No schedule will be displayed to users.
Generation of alerts in case reading is not received as per schedule.
Escalations:
For Manual Testing: Escalations are triggered in the following case via an in-app alert:
Role
Escalation
Governing Body + ULB employee
Test results pending beyond [X] days as per test schedule
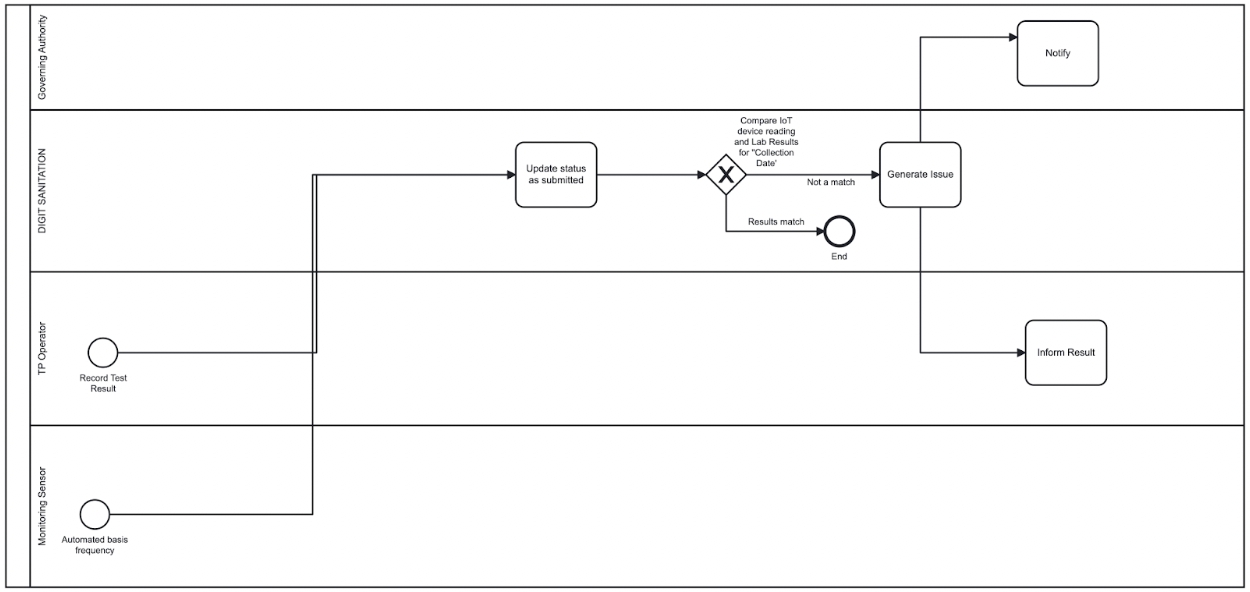
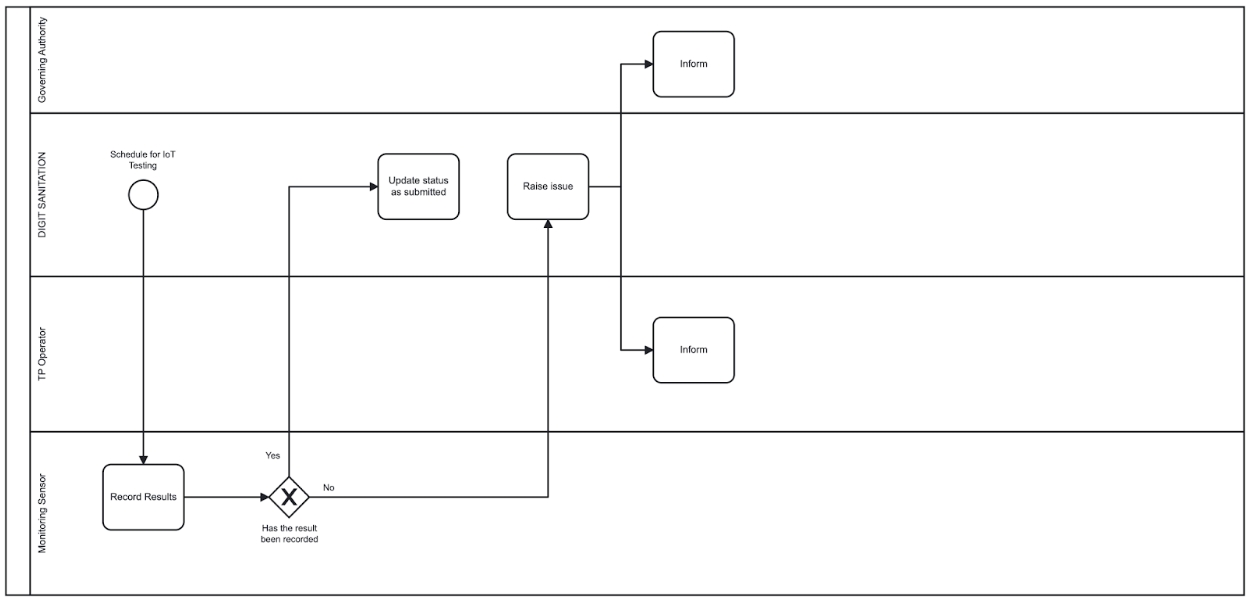
Record Test Results:
Test results may be recorded in 2 ways:
Manual Recording by user (lab testing).
Automated recording via integration with IoT device.
For Manual Recording (Lab Testing)-
Recording of test results will be done by the user in two cases:
Recording results against schedule.
Recording Results on demand: Adhoc tests conducted/instructed by governing authorities.
Recording Results Against Schedule-
The process flow will start with the treatment plant operator receiving a notification regarding an upcoming test. The following is the process flow for the manual recording of test results:
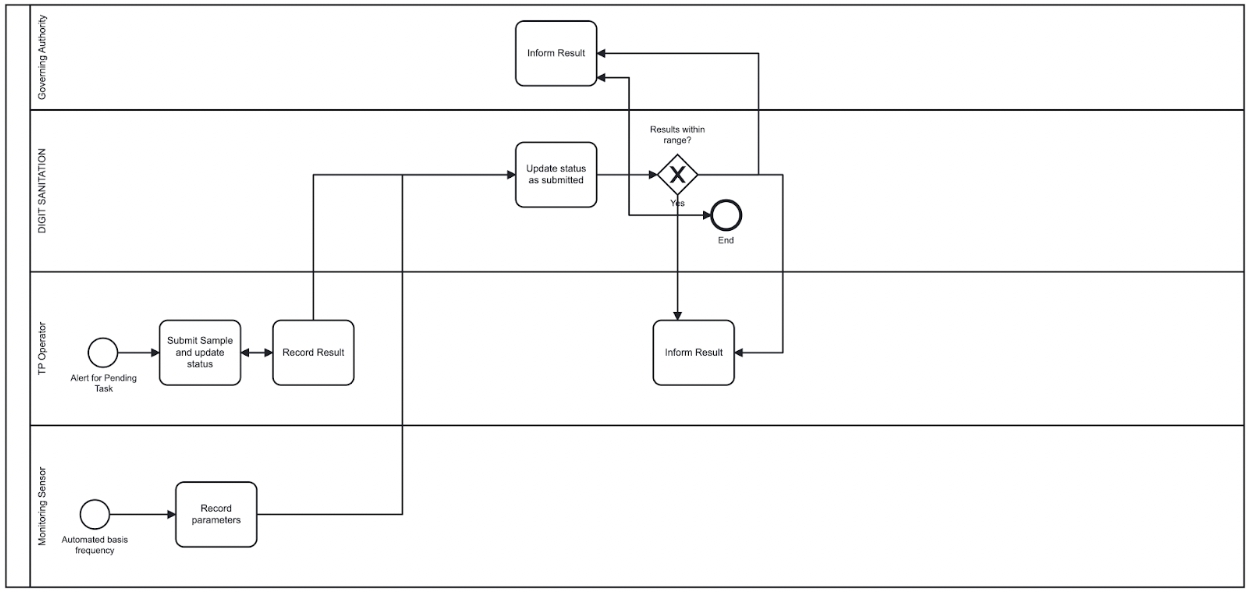
Recording Results: Workflow
Test Result Status
Roles
Action
Next Status
Scheduled
FSTPO
ULB employee
Submit sample for testing
Pending results
Pending results
FSTPO
ULB employee
Update Results
Submitted
The status of a scheduled test is auto set as “Scheduled”.
The sample has to be submitted to the lab (internal or external) for testing. The status of the same will be updated in the system by the user to “Pending Results”.
On recording test results, the status will be updated to “Scheduled”.
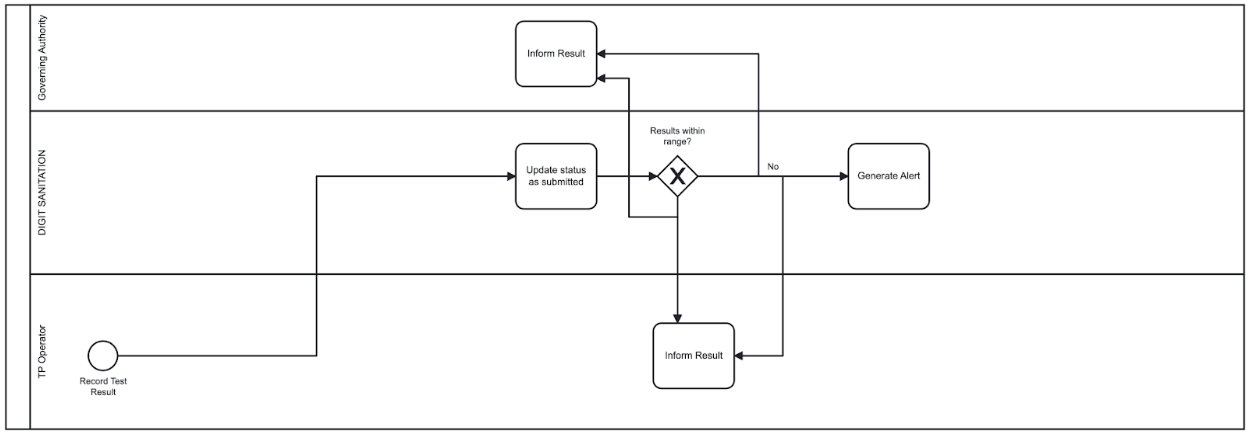
Recording Results On Demand-
The functionality will be made available to the record results on demand to the user.
No workflow will be available in case of recording results on demand.
The user will be able to record results by filling a form.
Selection of a lab used for testing is optional in this case.
Status of submitted results will be set as ‘Submitted’.
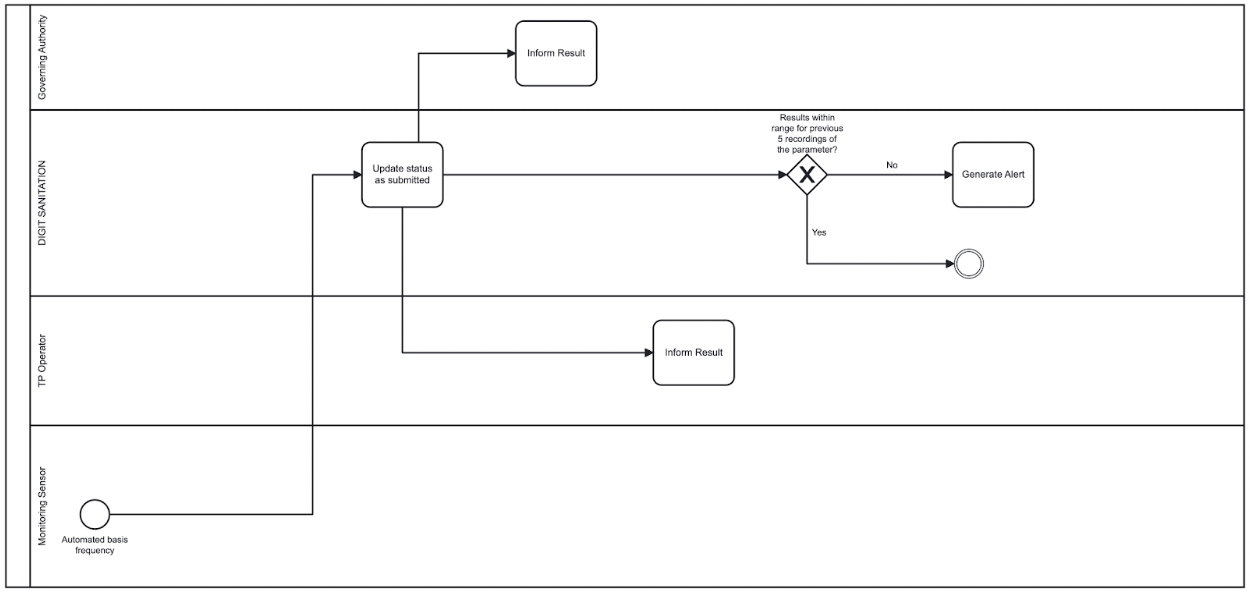
Automated Recording Via Integration with IoT Device-
In case of integration with IoT devices, results against scheduled tests will be recorded. Alerts in case of non upload are mentioned in the alerts section below.
Anomaly Detection:
Anomalies will be generated in case of the following:
Lab results not as per the benchmark.
IoT device results are not as per the benchmark.
Lab results and device results do not match.
Device not working.
Lab results not as per the benchmark-
This is to be generated when the manual test results uploaded by the test uploader are not as per the benchmarks defined (adjusted for deviations, configurable at plant level).
IoT results not as per the benchmark-
This is to be generated when the loT test results recorded via the integration are not as per the benchmarks defined for [X] days (adjusted for deviations defined while setting testing parameters).
Generation of alerts: Device results and lab results do not match-
In case the data that is recorded by the sensor does not match the data in the lab test result, an auto alert will be generated.
Date to be matched on
Sample collection Date
If IoT result is not available for the sample collection date, the closest date after for which the IoT data is available will be considered
Deviation allowed
X%
Generation of alert: No reading received from the device-
In case no reading is received from the sensor based on the schedule, an auto alert will be generated in the system.
Treatment Quality Monitoring: Functional Specifications
Treatment Process
Attribute
Type
Mandatory
Comments
Validation Required?
Treatment Process ID
Numeric
Y
Auto-generated numeric value which will act as a unique identifier for a process flow
N, this value should be system generated
Process Name
Text
Y
This is the commonly used identifier for the process flow
Max characters - 256
Status
Array
Y
Status of the process flow
Active/Inactive, Single Select
Treatment Process Type
Array
Y
The dropdown will be auto populated basis the list of waste maintained in the MDMS
Single Select
Treatment Process Subtype
Array
Y
The dropdown will be auto populated basis the list of waste maintained in the MDMS
Single Select
Plants
Attribute
Type
Mandatory
Comments
Validation Required?
Plant ID
Numeric
Y
Auto-generated numeric value which will act as a unique identifier for a plan.
Auto-generated
Plant Name
Text
Y
This is the commonly used identifier for the plant
Maximum charatcters - 128
Plant Type
Array
Y
Single select only, faecal sludge, solid waste, co-treatment
Tenant Id
Text
Y
Status
Array
Y
Status of the plant
Active/inactive, single select
Geolocation
Lat,Long
Y
Capture the exact latitude-longitude
Stages
Attribute
Type
Mandatory
Comments
Validation Required?
Stage ID
Numeric
Y
Auto-generated numeric value which will act as a unique identifier for a Job ID
Auto-generated
Stage Name
Text
Y
This is the commonly-used identifier for the Job
Maximum characters - 128
Minimum xharacters - NA
Status
Boolean
Y
Status of the stage
Active/inactive, single select
Input Quality Measurement Required
Boolean
Y
This selection will allow the user to set up if the input quality for the particular input type needs to be monitored. A user should be able to enable and disable input quality measurement requirement independently for each type
Yes/no, single select
Output Type
Array
Y
The dropdown will be auto-populated basis the list of output types
Multi-select
Output Quality Measurement Required
Boolean
Y
This selection will allow the user to set up if the output quality for the particular job needs to be monitored. A user should be able to enable and disable the output quality measurement requirement independently for each type
Yes/no, single select
Testing Parameters
Attribute
Type
Mandatory
Validation
Quality Parameter
Array
Y
Selecting from the predefined of the above-mentioned quality parameters and standards.
single select
Quality Parameter Unit of Measurement
Array
Y
Selection of the unit of measurement (mg/L, Absolute value etc). Single select
Benchmark Rule
Array
Y
Options include X>=,<=R, =<Y and >=Z, single select
Benchmark Value
Numeric
Y
Entered by user, numeric only
Testing Frequency - Manual (Days)
Numeric
Y
Selecting a custom frequency range for laboratory testing based on consent to operate, numeric only
Monitoring Frequency - Quality Sensor (Days)
Numeric
N
Selecting a custom frequency
Note: Should be optional if the ULB/state choses not to have sensor-based monitoring. Numeric only
Configure IoT Devices
Attribute
Type
Required?
Comments
Configuration Date
Datetime
Y
Device Type
Text
Y
Selection from the device master data
[“GPS Sensor”, “pH Sensor”, “Accelerometer”, “Light Sensor”]
Plant
Text
Y
Treatment Process
Text
Y
Stage
Text
Y
Output Type
Text
Y
Parameters
Array
Y
The parameters are monitored by the device
Monitoring Frequency
Numeric
Y
Custom frequency for the device
Calibration Date
Datetime
Y
Input from the user about any change in the calibration/maintenance of the device
Calibration Accuracy
Array
Y
Range to indicate the permissible deviation in the accuracy
IsConnected?
Boolean
Y
To indicate the connectivity of the device
Connectivity History
?
Y
Date-wise device audit log to know the connectivity status
Verification History
?
Date-wise device verification log to know the days when device input was verified with laboratory results
Testing Schedule
Attribute
Type
Mandataroy
Validation
Test ID
Alphanumeric
View only
Auto-generated on the creation of schedule
Plant Name
Text
View only
Auto-populated on the creation of schedule
Treatment Process
Text
View only
Auto-populated on the creation of schedule
Treatment Process Type
Text
View only
Auto-populated on the creation of schedule
Stage
Text
View only
Auto-populated on the creation of schedule
Output Type
Text
View only
Auto-populated on the creation of schedule
Test Type
Array
Lab/IoT, auto-selected to Lab
Parameter 1…n
Text
View only
Auto-populated on the creation of schedule
Testing Date
Date
View only
Date calculated through the predefined laboratory testing schedule
SLA
Numeric
View only
Difference between the current date and testing date: The compliance to a testing schedule can be checked through this field. However, the actions based on failed/successful compliance falls under vendor management, which is not in scope currently and will be taken up separately under vendor management
Status
Text
View only
Status to be auto set to ‘Scheduled’
Test Results
Attribute
Type
Required?
Comments
Test ID
Numeric
Y
Auto-generated by system
Plant Name
Array
View only
Auto-populated on the creation of schedule, single select for on-demand test
Treatment Process
Array
View only
Auto-populated on the creation of schedule, single select for on-demand test
Treatment Process Type
Array
View only
Auto-populated on the creation of schedule, single select for on-demand test
Stage
Array
View only
Auto-populated on the creation of schedule, single select for on-demand test
Output Type
Array
View only
Auto-populated on the creation of schedule, single select for on-demand test
Test Type
Array
Lab/IoT, auto-selected to lab for on demand
Lab Submitted to
Text
Y
This will not be required in case test type = IoT
Quality Parameter 1
Numeric
Y
Validation to be applied at impel
Quality Parameter 2
Numeric
Y
Validation to be applied at impel
Quality Parameter 3
Numeric
Y
Validation to be applied at impel
Quality Parameter n
Numeric
Y
Validation to be applied at impel
Collection Time
Date
Y
This is the date-time during which the user updates status to pending Results. for IoT, this is the time sensor records reading
Attachment
Document
Y
For a given collection location, photo or PDF proof of laboratory result mentioning the information of above-mentioned parameters
Alert: Lab and IoT Result Not As Per the Benchmark; Lab and Device Results Do Not Match
Attribute
Type
Required?
Comments
Alert DateTime
Datetime
Y
Auto-captured based on date-time
Alert Type
Text
Y
Auto-captured
Lab test results not as per the benchmark
Plant Name
Text
Y
Process Name
Text
Y
Process Type
Text
Y
Parameter 1…n
Text
Y
UoM
Text
Y
Benchmark
Number
Y
Results
Number
Y
Test Type
Text
Y
Auto-selected to lab/IoT, or both
Alert: No Reading Received From the Device
Attribute
Type
Required?
Comments
Alert DateTime
Datetime
Y
Auto captured based on date-time
Alert Type
Text
Y
Auto captured
No reading received from the device
Plant Name
Text
Y
Process Name
Text
Y
Process Type
Text
Y
Device ID
Numeric
Y
Sensor Monitoring
Below is an illustration of the communication between monitoring sensor and DIGIT:
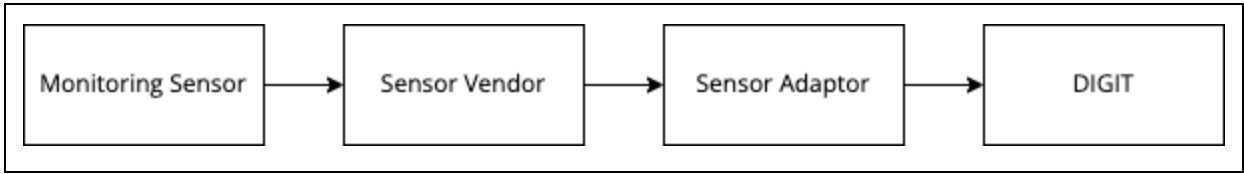
Monitoring sensor - Communicates the actual readings (in AMP etc) to the vendor’s system.
Sensor vendor - Converts the readings into the values against the parameters.
Sensor adaptor - Communicates the values through the standardised APIs designed by DIGIT.
Sensors will be installed at one or multiple stages of the plant, and device details will be recorded in the system.
Sensor monitoring: The user will have a view of all the devices available at the plant along with their status using the sensor monitoring tab at the front end.
Treatment Quality Monitoring: Dashboard
The TQM dashboard will be made available to both the TRP, the ULB admin and the state admin. The access to data in the dashboard will be based on the following roles:
TRP will be available to view dashboard only for the assigned plant.
The ULB admin will be able to view the dashboard for all the plants in the ULB.
The state admin will be able to view the dashboard for all the plants in the ULB.
Navigation:
On landing on the dashboard, the user can navigate across treatment process types, to view the dashboard specific to the treatment process type.
Filters:
Date range: Users should be able to filter based on the date range.
ULB: Users should be able to filter based on the ULB. For plant TRP and ULB employees, the ULB is auto-selected to the ULB the plant and employee is tagged to. For a state user, all ULBs are available.
Plant: Users should be able to filter based on the plant: For plant TRP, plants that the TRP is tagged to is auto-selected. For ULB employees, plants tagged to the ULB to which the employee belongs should be available in the dropdown. For a state user, all plants are available.
Other functionalities:
Share:
Users should be able to share a filtered dashboard over WhatsApp in an image format.
Users should be able to share filtered charts/tables over WhatsApp in an image format.
Download:
Users should be able to download the filtered dashboard in PDF and image formats.
Users should be able to download filtered charts/tables in PDF and image formats.
Metrics:
Overall KPIs- The dashboard will display the following KPIs:
Total incoming sludge: The sum of the total sludge that is disposed of at the plant for the selected time period.
Number of trips: A count of the total incoming vehicles at the treatment plant for the selected time period.
Overall quality: The number of tests where all parameters are as per the benchmarks as compared to the total number of test results recorded.
Compliance percentage: The percentage of tests where results have been recorded.
Total alerts: A count of the total alerts raised of the following types: Test results not as per the benchmark, no reading from the IoT device, and lab results and IoT results not matching.
Treatment Quality Overview:
KPIs:
Total plants: A count of the unique plants for the particular treatment process.
Count of plants who have passed the treatment quality as per the last recorded test.
Count of plants who have failed the treatment quality as per the last recorded test.
Treatment quality is said to have passed if all parameters for final output(s) of a treatment process are as per the benchmarks.
Treatment quality is said to have failed if one or more parameters for final output(s) of a treatment process is not as per the benchmarks.
Map:
A map view of the location of each plant will be displayed as part of the dashboard. Plants here will be colour coded, based on whether it has passed/failed the treatment quality. (Red = Failed, Green = passed).
Table:
A table will be available on the plant-wise details of the test results (pass/fail) and compliance percentage. This will be as per the last test result. The user will also be able to see a change in the compliance percentage as compared to the last month. A drilldown will be made available for a plant via this table. For TRP users and ULBs where only one plant is tagged for the process type, the drilled table is automatically visible.On drilldown, the following is viewable to the user:
Heading - Name of the plant.
Table displaying the following fields:
a. Stage, output type, value of parameters, and compliance percentage.
b. Button to view the trends for a particular stage.
Toggle to toggle between IoT readings and lab results.
Trends of parameter readings:
This chart will be available once the user clicks on the view trend button in the table button.
The table shows the trend for one parameter over time, and provides a view of the benchmark for comparison. A toggle is available to navigate between the parameters. Detailed metric details for the Treatment Quality Monitoring dashboard are viewable below:
Section Heading
Chart Heading
Subheading
Definitions ((This will appear on the dashboard whenever a user hovers on the metric wherever applicable))
Chart Type
X-Axis
Y-Axis
Value
Columns
How to calculate
Boundary
Dtill down/Toggle
Comparsion KPIs, if any
Show comparison in
Specific to State/ULB/ TRP/all
Tooltip on Hover on Data Point
Input Fields
1
Input
Total Incoming Sludge
NA
Total Incoming sludge from registered and unregistered vehicles
KPI
NA
NA
Total Incoming Sludge
NA
Total incoming sludge = (Volume of Waste Disposed for Registered Vehicles) + (Volume of Waste Disposed for Unregistered Vehicles)
State, Plant ULB
NA
NA
NA
NA
2
Input
# incoming trips
NA
Number of trips disposed at the Treatment plant
KPI
NA
NA
Count of Trips to the Treatment plant from registered and unregistered vehicles
NA
Number of trips disposed = Count(DISTINCT Trip ID)
State, Plant ULB
NA
NA
NA
NA
3
Treatment Quality
Overall Quality
NA
% of tests where all parameters are as per benchmarks
KPI
NA
NA
% of test results meeting benchmarks
NA
Overall Quality = (Number of tests where all parameters meet benchmarks / Total number of tests) * 100
State, Plant ULB
NA
NA
NA
NA
4
Treatment Quality
Compliance
NA
% of tests where results have been recorded
KPI
NA
NA
% of tests with Status as submitted out of total tests
Compliance % = (Count of Test ID in status 'Submitted' / Count (Distinct Trip ID) * 100
State, Plant ULB
NA
NA
NA
NA
5
Alerts
Total Alerts
NA
Total Alerts raised by the system in the following categories: 1) Test Results not as per benchmark 2) No reading from IoT device 3) Lab results and IoT results not matching
KPI
NA
NA
Total Alerts
Count(DISTINCT AlertID)
State, Plant ULB
NA
NA
NA
NA
6
Treatment Quality Plants
Total Plants
NA
NA
NA
NA
NA
Count of Plants
Count (Distinct PlantID)
State, Plant ULB
NA
NA
NA
NA
7
Treatment Quality Plants
Treatment Quality Passed
NA
Treatment quality is considered passed if all parameters of both Biosolids and Effluents are as per benchmarks for the output of the Treatment Process in the last test recorded.
NA
NA
NA
Count of Plants with Treatment Quality Passed
Treatment Quality for Output type =IF(COUNTIF(All Parameters Meet Benchmarks, FALSE) = 0, "Treatment Quality for Output type passed ", "Treatment Quality for Output type failed") Treatment Quality for Plant passed = =IF(COUNTIF(Treatment Quality for Output type, FALSE) = 0, " Treatment Quality Passed ", "Treatment Quality Failed")
State, Plant ULB
NA
NA
NA
NA
8
Treatment Quality Plants
Treatment Quality Failed
NA
Treatment quality is considered failed when 1 or more parameters of Biosolids or Effluents are not as per benchmarks for the output of the Treatment Process in the last test recorded.
NA
NA
NA
Count of Plants with Treatment Quality Failed
Count (Distinct PlantID) - Treatment Quality Passed
State, Plant ULB
NA
NA
NA
NA
9
Treatment Quality Plants
NA
NA
NA
Map
NA
NA
Point = Geolocation of Plant Plant Icon Colour - Green if Treatment Quality Passed, Red if Treatment Quality Failed
State, Plant ULB
NA
NA
NA
NA
Name of Plant
10
Treatment Quality Plants
NA
NA
NA
Table
NA
NA
NA
Plant Name, Test Result, Compliance %
Test Result Same as S.No 7 and S.No 8
State, Plant ULB
NA
NA
NA
NA
11
Treatment Quality Plants
NA
NA
NA
Table
NA
NA
NA
Stage, Output Type, Parameters 1...n, Compliance %
Mentioned above
State, Plant ULB
NA
Compliance %
% from last month
NA
12
Trend in [Parameter Name] Readings
NA
NA
NA
Multi-Line Chart
Test Dates
Parameter Value
- Value of Device Reading - Value of Lab results
NA
NA
Plant
NA
NA
NA
NA
Date Lab result - X Device Reading - Y
Guided navigation:
If the user clicks on the help button, it will give a walkthrough of the entire screen, including the role of each button placed with two buttons:
Skip: If the user wants to skip the walkthrough at any point.
Next: It will proceed to the next action aligned.
Treatment Quality Monitoring: Noun Verb Mapping
Entities
Actions
Create
Read
Search
Update
Delete
Deactivate
Test Schedule
X
X
X
Status
X
Lab Result (Evidence)
X
X
Device Result
X
X
Anomalieis
X
Roles
There are multiple business models when it comes to lab testing and O&M of a treatment plant. In case of some FSTPs in Tamil Nadu, treatment plant operators are employees of a vendor who have a build-and-manage-model, and are directly responsible for resolving issues. Some FSTPs have an in-house lab to test the quality, whereas others send samples to other labs for testing. In certain cases, the ULB employee is responsible for testing and resolution of issues. Keeping this in mind, it is imperative that we design roles in the system in a flexible way such that the product can be implemented in various models.
Super Admin
All
Plant Admin
Create, edit and disable plants
Create, edit and disable Workcentres
Create, edit and disable assets
Create, edit and disable Devices
Map assets and devices
Map process flow and workcentres
Map assets and jobs
Set up escalation matrix
Process Admin
Create, edit and disable process flow
Create, edit and disable Jobs
Map jobs and process flow
Test Viewer
1) View upcoming tests and status
Plant Operator
1) Update status of test to Sample Submitted
Test Uploader
1) Upload test results
Dashboard Viewer
1) View dashboards
See noun verb mapping for roles below:
Entity
Actions
Create (C)
Read (R)
Search (S)
Update (U)
Delete (D)
Deactivate
Process Flows
X
Jobs
X
Standards
x
Plant
X
Workcentre
X
Assets
X
Test Schedule
X
X
X
Status
X
X
Lab Result (Evidence)
X
Device Result
X
X
Anomalieis
X
X
Issue
x
Dashboards
x
x
Plant Admin
Entity
Actions
Create (C)
Read (R)
Search (S)
Update (U)
Delete (D)
Deactivate
Process Flows
x
x
x
x
Jobs
x
x
x
x
Standards
x
x
x
x
Plant
X
Workcentre
X
Assets
X
Test Schedule
X
X
X
X
X
Status
X
X
X
X
X
Lab Result (Evidence)
X
X
X
X
X
Device Result
X
X
X
X
X
Anomalieis
X
X
X
X
X
Issue
X
X
X
X
x
Dashboards
X
X
X
X
x
Process Admin
Entity
Actions
Create (C)
Read (R)
Search (S)
Update (U)
Delete (D)
Deactivate
Process Flows
Jobs
Standards
Plant
X
X
X
X
X
X
Workcentre
X
X
X
X
X
X
Assets
X
X
X
X
X
X
Test Schedule
X
X
X
X
X
Status
X
X
X
X
X
Lab Result (Evidence)
X
X
X
X
X
Device Result
X
X
X
X
X
Anomalieis
X
X
X
X
X
Issue
X
X
X
X
x
Dashboards
X
X
X
X
x
Test Viewer
Entity
Actions
Create (C)
Read (R)
Search (S)
Update (U)
Delete (D)
Deactivate
Process Flows
X
X
X
X
X
X
Jobs
X
X
X
X
X
X
Standards
X
X
X
X
X
X
Plant
X
X
X
X
X
X
Workcentre
X
X
X
X
X
X
Assets
X
X
X
X
X
X
Test Schedule
X
X
X
Status
X
X
X
X
X
Lab Result (Evidence)
X
X
X
X
X
Device Result
X
X
X
X
X
Anomalieis
X
X
X
X
X
Issue
X
X
X
X
x
Dashboards
X
X
X
X
x
Plant Operator
Entity
Actions
Create (C)
Read (R)
Search (S)
Update (U)
Delete (D)
Deactivate
Process Flows
X
X
X
X
X
X
Jobs
X
X
X
X
X
X
Standards
X
X
X
X
X
X
Plant
X
X
X
X
X
X
Workcentre
X
X
X
X
X
X
Assets
X
X
X
X
X
X
Test Schedule
X
X
Status
X
Lab Result (Evidence)
X
Device Result
X
X
X
Anomalieis
X
X
X
X
Issue
X
X
X
X
x
Dashboards
X
X
X
X
x
Test Uploader
Entity
Actions
Create (C)
Read (R)
Search (S)
Update (U)
Delete (D)
Deactivate
Process Flows
X
X
X
X
X
X
Jobs
X
X
X
X
X
X
Standards
X
X
X
X
X
X
Plant
X
X
X
X
X
X
Workcentre
X
X
X
X
X
X
Assets
X
X
X
X
X
X
Test Schedule
X
X
Status
X
Lab Result (Evidence)
X
Device Result
X
X
X
Anomalieis
X
X
X
X
Issue
X
X
X
X
x
Dashboards
X
X
X
X
x
Plant Operator
Entity
Actions
Create (C)
Read (R)
Search (S)
Update (U)
Delete (D)
Deactivate
Process Flows
X
X
X
X
X
X
Jobs
X
X
X
X
X
X
Standards
X
X
X
X
X
X
Plant
X
X
X
X
X
X
Workcentre
X
X
X
X
X
X
Assets
X
X
X
X
X
X
Test Schedule
X
X
Status
X
Lab Result (Evidence)
X
X
X
X
X
Device Result
X
X
X
X
X
Anomalieis
X
X
X
X
X
Issue
X
X
X
X
x
Dashboards
X
X
X
X
x
Issue Creator
Entity
Actions
Create (C)
Read (R)
Search (S)
Update (U)
Delete (D)
Deactivate
Process Flows
X
X
X
X
X
X
Jobs
X
X
X
X
X
X
Standards
X
X
X
X
X
X
Plant
X
X
X
X
X
X
Workcentre
X
X
X
X
X
X
Assets
X
X
X
X
X
X
Test Schedule
X
X
X
X
X
Status
X
X
X
X
X
Lab Result (Evidence)
X
X
X
X
X
Device Result
X
X
X
X
X
Anomalieis
X
X
X
X
X
Issue
X
x
Dashboards
X
X
X
X
x
Issue Editor (different for different types of issues)
Entity
Actions
Create (C)
Read (R)
Search (S)
Update (U)
Delete (D)
Deactivate
Process Flows
X
X
X
X
X
X
Jobs
X
X
X
X
X
X
Standards
X
X
X
X
X
X
Plant
X
X
X
X
X
X
Workcentre
X
X
X
X
X
X
Assets
X
X
X
X
X
X
Test Schedule
X
X
X
X
X
Status
X
X
X
X
X
Lab Result (Evidence)
X
X
X
X
X
Device Result
X
X
X
X
X
Anomalieis
X
X
X
X
X
Issue
X
x
Dashboards
X
X
X
X
x
Dashboards
Entity
Actions
Create (C)
Read (R)
Search (S)
Update (U)
Delete (D)
Deactivate
Process Flows
X
X
X
X
X
X
Jobs
X
X
X
X
X
X
Standards
X
X
X
X
X
X
Plant
X
X
X
X
X
X
Workcentre
X
X
X
X
X
X
Assets
X
X
X
X
X
X
Test Schedule
X
X
X
X
X
Status
X
X
X
X
X
Lab Result (Evidence)
X
X
X
X
X
Device Result
X
X
X
X
X
Anomalies
X
X
X
X
X
Issue
X
X
X
X
X
Dashboards
X
X
x
User Interface Design (Exemplar)
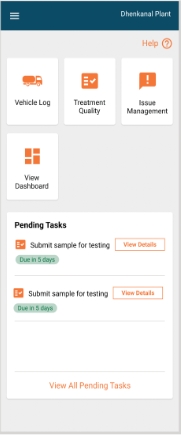
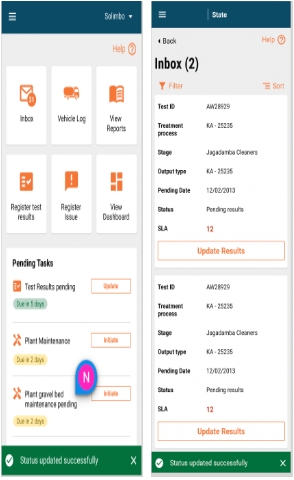
Landing Page: Plant Operator
The user will land on the home page post login. The following actions can be performed by the user:
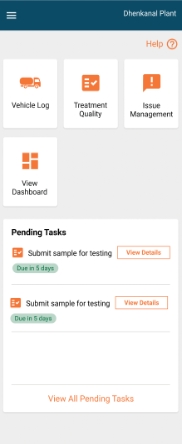
The plant name is visible on the top right hand corner of the screen.
A help button is available for the user to get a guided view of the page. This is available on every page.
Cards are viewable for the following modules:
a. Vehicle log module (record incoming vehicles)
b. Treatment quality module
c. View dashboard
Clicking on each of these cards will take the user to the Homepage for the specific module.
List of pending tasks: This will show the list of tests pending within the next [X] days. The next action item in the task workflow will be displayed beside a pending task for a user to take prompt action. A button for “View All Pending Tasks” will be displayed which will redirect the user to “All Pending Tasks”.
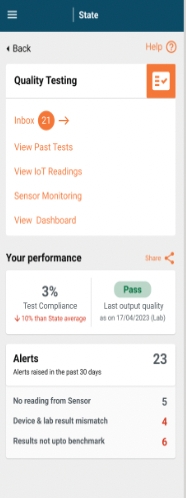
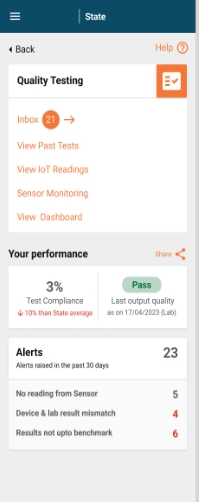
Treatment Quality Module (TQM) Home Page
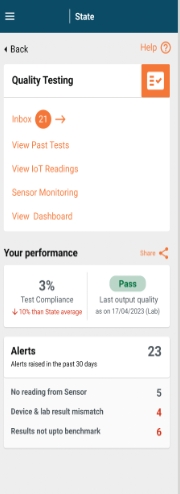
On clicking on the treatment quality card, the user is redirected to the TQM home page. The following actions can be performed by the user:
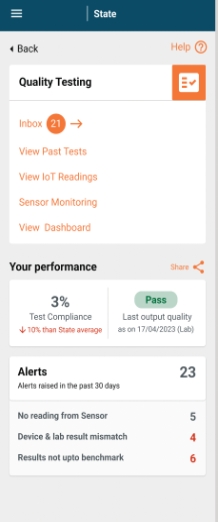
View and take action on upcoming tests using the inbox. The inbox will show a count of upcoming tests beside it.
View past test results: Past results from both lab and IoT devices will be displayed here.
View IoT readings: The user can access the record of IoT readings here.
Sensor Monitoring: The user can access a list of IoT devices along with their status here.
View dashboard: The user will be directed to the treatment quality dashboard.
View performance: This widget will show the performance of the plant in regards to treatment quality and will display the following KPIs:
a. Test compliance: Compliance percentage of plant with regards to the treatment quality and its comparison to state level compliance percentage.
b. Last treatment quality result - Pass/fail and date of the test.
c. Count of alerts raised in the past 30 days.
d. Distribution of alerts based on the alert category.
Go back to the Landing page using the back button.
A help button is available for the user to get a guided view of the page. This is available on every page.
View List of Upcoming Tests
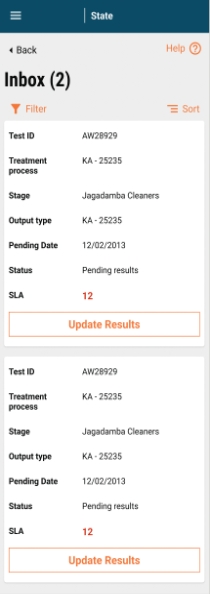
On clicking on inbox, the user is redirected to the list of upcoming tests. This will show only a list of lab tests. The user can perform the following tasks:
Total count of upcoming tests are displayed beside the inbox in brackets.
View list of upcoming tests. The following will be the fields displayed:
Total count of upcoming tests are displayed beside the inbox in brackets.
View list of upcoming tests. The following will be the fields displayed:
a. Test ID.
b. Treatment process (in case there is only 1 treatment process for the plant, this field will not be displayed).
c. Stage: This will display the process stage where the sample is to be collected from.
d. Output type: Biosolids/effluents.
e. Pending date: This is the test date as per schedule.
f. Status: status of the test.
g. SLA: Show difference between test due date and today.
An action item available based on the next status in the workflow will be displayed:
a. For test results in the scheduled stage, update status will be displayed.
b. For tests in the pending results stage, update results will be displayed.
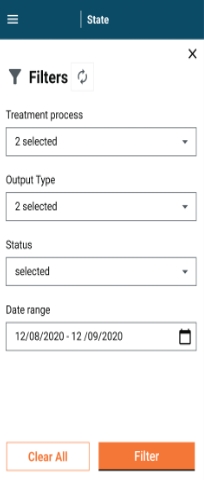
Filter tests: On clicking on filter, a pop-up will be displayed:
a. The following filters are available:
Treatment process: (In case there is only 1 treatment process for the plant, this field will not be displayed). This will be a dropdown showing the values for treatment processes configured for the plant. The selected treatment process is displayed here on selection. If not, the field is left blank.
Output type: This will be a dropdown showing values for output types configured for the plant. The selected output type is displayed here on selection. If not, the field is left blank.
Status: This will be a dropdown showing values for the status in the treatment quality workflow. The selected status is displayed here on selection. If not, the field is left blank.
Date range: Selection of date range (calendar view): Selected date range is displayed here on selection. If not, the field is left blank.
b. On selecting values for the filters above, a user can click on filter to filter the inbox.
c. To clear filters, a user can click on clear all.
d. To close the pop-up, a user can click on the cross on the top right hand corner of the screen.
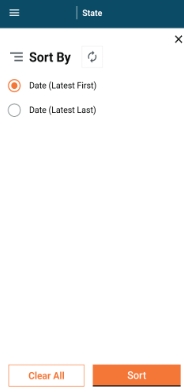
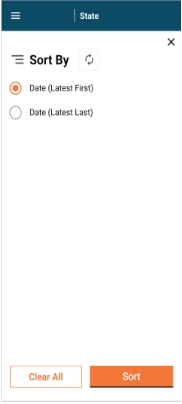
Sort: On clicking on sort, a pop-up will be displayed:
a. Tests can be sorted by the pending date:
Date (Latest first)
Date (Latest Last)
b. On selecting values for sort above, the user can click on sort to sort the inbox.
c. To clear sort, a user can click on clear all.
d. To close the pop-up, a user can click on the cross on the top right hand corner of the screen.
Go back to the landing page using the back button.
A help button is available for the user to get a guided view of the page. This is available on every page.
View Test Details
Test Details can be viewed by the user in 2 ways:
Via the pending tasks.
Via inbox.
View Test Details Via Pending Tasks
The list of pending tasks can be accessed via the landing page for TQM. This will show the list of tests pending within the next [X] days.
The next action item in the task workflow will be displayed as a button beside a pending task for a user to take prompt action. On clicking on the button, the user will be redirected to the test details page.
View Test Details Via Inbox
A list of tests can be accessed on the inbox. An action item is available based on the next status in the workflow will be displayed:
For test results in the scheduled stage, the update status will be displayed.
For tests in the pending results stage, the update results will be displayed.
On clicking on the action item, the user will be redirected to the test details page.
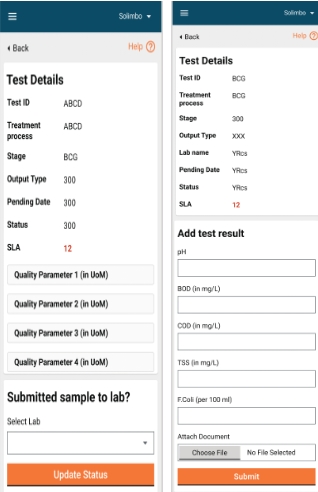
The test details page will consist of 2 cards:
The first card will display the following fields:
Test ID
Treatment Process
Stage
Output Type
Pending Date
Status
Parameters to be tested along with their unit of measurement
SLA (This will be displayed in Red/green basis SLA. If today>Pending date, this is red, If today<pending date, then green).
The second card will be based on the test status:
For tests in status ‘Scheduled’, the user will be asked to select a lab.
For tests in status “Pending Results”, the user will be asked to add test results
The user can go back using the back button - The redirection will be based on the page the user has accessed the test details page from. A help button is available for the user to get a guided view of the page. This is available on every page.
Update Tests
Tests can be updated by the user from the test details page. The test details page will display the next action item for the user based on the workflow test. For tests with the wWorkflow status ‘Scheduled’, the user will be prompted to confirm if sample has been submitted to the lab for testing.
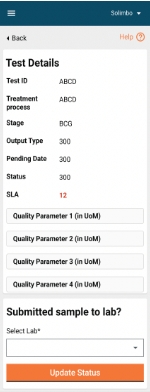
The user can perform the following actions:
Select a lab from a dropdown list configured in the MDMS.
Update status of the test. The button will be deactivated if Lab is not selected, and will only be activated once selection is made. Once the user clicks on update status, he/she is redirected back to the page from which test details were accessed and a snack bar confirms the status update and the action Item button shows updated next step.
In case an update of status fails, the user will remain on the same page and a failure message will be displayed to the user.
For tests with the workflow status “Pending Status”, the user will be prompted to fill test results.
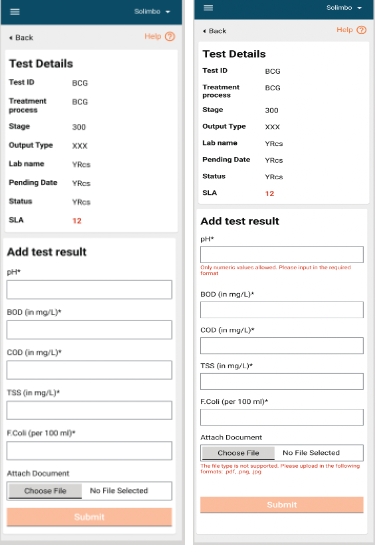
The user can perform the following actions:
Update parameter readings (mandatory fields) The following validations will be applied:
a. Only numerical values will be viewable here. In case of non numerical values, the following error message is displayed “Only numeric values allowed. Please input in the required format”.
Attach documents (non-mandatory): The following validations will be applied:
a. Only files in the following formats will be supported: .png, .jpg. .pdf. In case a file of unsupported format is selected, the following error will be displayed “The file type is not supported. Please upload in the following formats: .pdf, .png, .jpg”.
b. File size of maximum X mb allowed. In case file size is larger than permitted value, the following error will be displayed “The file size is too large. Please upload a file below x mbs”.
Submit test results by clicking on the ‘Submit’ button. The button will be deactivated if all is not selected, and will only be activated once selection is made. On clicking the submit button, a pop-up will be displayed to the user to confirm submission.
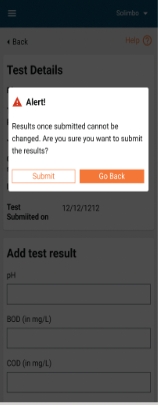
The following actions will be made available to the user:
Confirm submission by clicking on the ‘Submit’ button.
Go back to the test details page by clicking on the “Go back” button.
On clicking the submit button and failure to submit test results, the user will remain on the same page and a failure message will be displayed.
On clicking the submit button and successful submission of the test results, the user will be redirected to the summary page and a snack bar will confirm the submission.
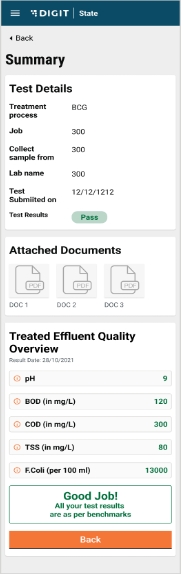
At this stage, the user will be displayed the summary of test results and whether it has passed/failed based on a comparison between the values entered by the user and the benchmarks. In case all values are as per the benchmarks, the test results will be displayed as ‘Pass’. All values will be shown in green and the user receives feedback that all results are as per benchmarks. The user can go back to the home page by clicking on the ‘Back’ button.
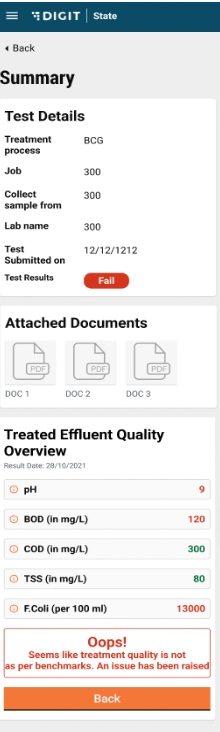
In case one or more values are not as per the benchmarks, the test results will be displayed as ‘Fail’. All values as per benchmarks will be shown in green. Values not as per the benchmarks are shown in red. The user is provided with information that the test results are not as per benchmark. The user can go back to the Home page by clicking on the ‘Back’ button.
View Past Test Results
Past test results (both IoT and Lab) can be viewed via the TQM landing page and by clicking on past tests.
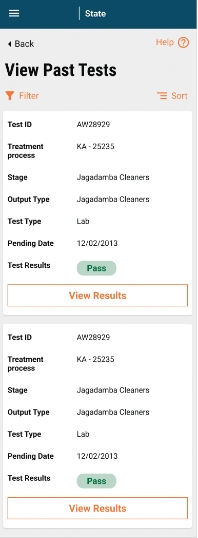
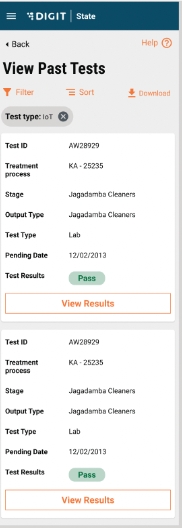
On clicking on past tests, the user is redirected to the list of past tests.
The user can perform the following tasks:
View the list of past tests. The following will be the fields displayed:
a. Test ID.
b. Treatment process (in case there is only 1 treatment process for the plant, this field will not be displayed).
c. Stage: This will display the process stage where the sample is to be collected from.
d. Output type: Biosolids/effluents
e. Pending date: This is the test date as per schedule.
f. Test result: Pass/fail.
2. View test details: The user can view test details by clicking on “View Results” button on each card.
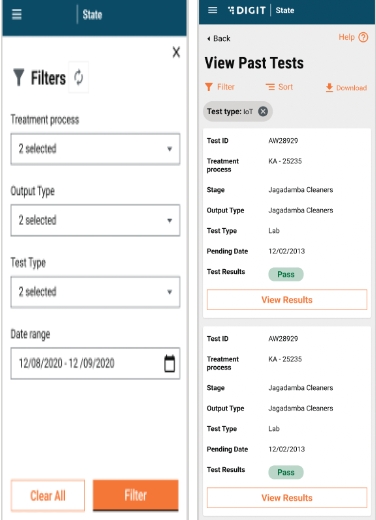
Filter tests: On clicking on Filter, a pop-up will be displayed. The following filters are available:
i. Treatment process: (in case there is only 1 treatment process for the plant, this field will not be displayed). This will be a dropdown showing values for Treatment Processes configured for the plant. The selected treatment process is displayed here on selection. If not, the field is left blank.
ii. Output type: This will be a dropdown showing values for the output types configured for the plant. The selected output type is displayed here on selection. If not, the field is left blank.
iii. Test type: This will be a dropdown showing values for the test type (IoT/Lab). The selected test type is displayed here on selection. If not, the field is left blank.
iv. Date range: The selection of date range (calendar view) - The selected date range is displayed here on selection. If not, the field is left blank.
On selecting values for filters above, the user can click on filter to filter the inbox. To clear filters, the user can click on clear all. To close the pop-up, a user can click on the cross on the top right hand corner of the screen. On selection of the filter, the selected filter is displayed on the screen. On clicking the cross button near the displayed filter, the filter is removed.
Sort: On clicking on sort, a pop-up will be displayed:
a. Tests can be sorted by the pending date:
Date (Latest first)
Date (Latest last)
b. On selecting values for sort above, the user can click on sort to sort the inbox.
c. To clear sort, the user can click on clear all.
d. To close the pop-up, the user can click on the cross on the top right hand corner of the screen.
In case filters/sort/search is applied and the user navigates to the test details page, on going back, the values of the filters/sort/search should remain the same.
The user can download the list of tests, filtered by selection in Excel and PDF format.
Go back to the Landing page using the back button.
A help button is available for the user to get a guided view of the page. This is available on every page.
On clicking the “View Results” button, the user will be redirected to the test summary page.
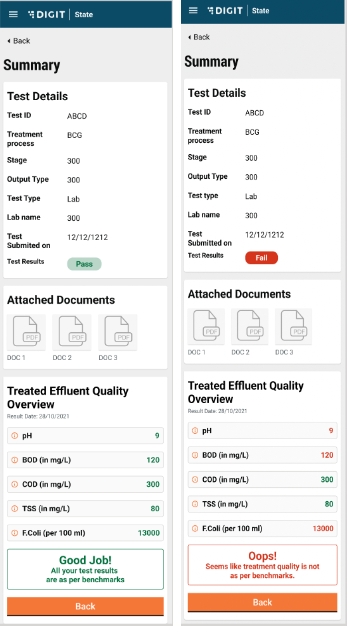
The page will have 2 cards:
The first card will display the following fields:
Test ID.
Treatment Process.
Stage.
Output Type.
Test Type.
Lab Name/Device ID: This will show Lab Name/Device ID based on the Test type.
Test submitted on.
Test Results: Pass/Fail.
The second card will display the following fields:
Parameters, their unit of measurement and the values of the parameters recorded. The values will be read/green basis whether they are as per benchmarks or not.
The user can go back to the list of tests by clicking on the ‘Back’ button, both on the top and bottom of the page.
View IoT Readings
IoT readings can be viewed via the TQM landing page and clicking on view IoT readings.
On clicking on View IoT readings, the user is redirected to the view tests page filter on test type: IoT.
The functionality of the page remains the same as the “View Past Tests” page.
Sensor Monitoring
Sensor monitoring can be accessed by clicking on the sensor monitoring link on the TQM landing page.

On clicking on sensor monitoring, the list of IoT devices are displayed.
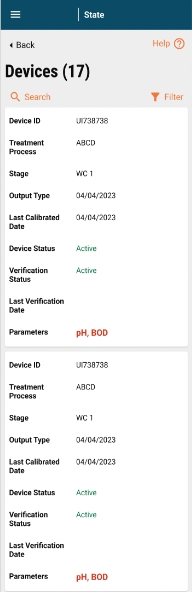
The following details are displayed on the page:
Total number of IoT devices is displayed beside the page heading in brackets.
A card is available for each device. The following details will be displayed:
- Device ID.
- Treatment Process.
- Stage.
- Output Type.
- Last Calibrated Date.
- Device Status.
- Verification Status.
- Last Verification Date.
- Parameters that the device monitors.
The user can perform the following actions:
Filter devices: On clicking on filter, a pop-up will be displayed.
a. The following filters are available:
i. Treatment process: (in case there is only 1 treatment process for the plant, this field will not be displayed). This will be a dropdown showing values for the treatment processes configured for the plant. The selected treatment process is displayed here on selection. If not, the field is left blank.
ii. Output type: This will be a dropdown showing values for the output types configured for the plant. The selected output type is displayed here on selection. If not, the field is left blank.
iii. Device status: This will be a radio button showing active/inactive
iv. Parameters: This will be a multi-select displaying all parameters configured on the backend.
b. On selecting values for filters above, the user can click on filter to filter the inbox.
c. To clear filters, the user can click on clear all.
d. To close the pop up, the user can click on the cross on the top right hand corner of the screen.
e. On selection of the filter, the selected filter is displayed on the screen. On clicking the cross button near the displayed filter, the filter is removed.
Search: On clicking on search, a pop-up will be displayed.
a. The user can search a device by device ID. Part search to be enabled.
View Dashboard
Dashboards can be accessed by clicking on the “View Dashboards” link on the TQM landing page.
Navigation:
On landing on the dashboard, the user can navigate across the treatment process types to view the dashboard specific to the treatment process type.
Filter:
Date range: Users should be able to filter based on the date range basis which dashboard is to be filtered.
Other functionalities:
Share:
Users should be able to share a filtered dashboard over WhatsApp in an image format.
Users should be able to share filtered charts/tables over WhatsApp in an image format.
Download:
Users should be able to download the filtered dashboard in PDF and image formats.
Users should be able to download filtered charts/tables in PDF and image formats.
Metrics:
Total incoming sludge: The sum of the total sludge that is disposed of at the plant for the selected time period.
Number of trips: A count of the total incoming vehicles at the treatment plant for the selected time period.
Overall quality: The number of tests where all parameters are as per the benchmarks as compared to the total number of test results recorded.
Compliance percentage: The percentage of tests where results have been recorded.
Total alerts: A count of the total alerts raised of the following types: Test results not as per the benchmark, no reading from the IoT device, and lab results and IoT results not matching.
Treatment Quality Overview:
KPIs:
Total tests - A count of the total tests for the filtered date range.
A count of tests that have passed treatment quality.
A count of tests that have failed the treatment quality.
Table:
Heading - Name of the plant.
Table displaying the following fields:
a. Stage, output type, value of parameters, and compliance percentage.
b. Button to view the trends for a particular stage.
Toggle to toggle between IoT readings and lab results.
Trends of parameter readings:
This chart will be available once the user clicks on the view trend button in the table button.
The table shows the trend for one parameter over time, and provides a view of the benchmark for comparison. A toggle is available to navigate between the parameters. Detailed metric details for the Treatment Quality Monitoring dashboard are viewable below:
Section Heading
Chart Heading
Subheading
Definitions ((This will appear on the dashboard whenever a user hovers on the metric wherever applicable))
Chart Type
X-Axis
Y-Axis
Value
Columns
How to calculate
Boundary
Dtill down/Toggle
Comparsion KPIs, if any
Show comparison in
Specific to State/ULB/ TRP/all
Tooltip on Hover on Data Point
Input Fields
1
Input
Total Incoming Sludge
NA
Total Incoming sludge from registered and unregistered vehicles
KPI
NA
NA
Total Incoming Sludge
NA
Total incoming sludge = (Volume of Waste Disposed for Registered Vehicles) + (Volume of Waste Disposed for Unregistered Vehicles)
State, Plant ULB
NA
NA
NA
NA
2
Input
# incoming trips
NA
Number of trips disposed at the Treatment plant
KPI
NA
NA
Count of Trips to the Treatment plant from registered and unregistered vehicles
NA
Number of trips disposed = Count(DISTINCT Trip ID)
State, Plant ULB
NA
NA
NA
NA
3
Treatment Quality
Overall Quality
NA
% of tests where all parameters are as per benchmarks
KPI
NA
NA
% of test results meeting benchmarks
NA
Overall Quality = (Number of tests where all parameters meet benchmarks / Total number of tests) * 100
State, Plant ULB
NA
NA
NA
NA
4
Treatment Quality
Compliance
NA
% of tests where results have been recorded
KPI
NA
NA
% of tests with Status as submitted out of total tests
Compliance % = (Count of Test ID in status 'Submitted' / Count (Distinct Trip ID) * 100
State, Plant ULB
NA
NA
NA
NA
5
Alerts
Total Alerts
NA
Total Alerts raised by the system in the following categories: 1) Test Results not as per benchmark 2) No reading from IoT device 3) Lab results and IoT results not matching
KPI
NA
NA
Total Alerts
Count(DISTINCT AlertID)
State, Plant ULB
NA
NA
NA
NA
6
Treatment Quality Plants
Total Plants
NA
NA
NA
NA
NA
Count of Plants
Count (Distinct PlantID)
State, Plant ULB
NA
NA
NA
NA
7
Treatment Quality Plants
Treatment Quality Passed
NA
Treatment quality is considered passed if all parameters of both Biosolids and Effluents are as per benchmarks for the output of the Treatment Process in the last test recorded.
NA
NA
NA
Count of Plants with Treatment Quality Passed
Treatment Quality for Output type =IF(COUNTIF(All Parameters Meet Benchmarks, FALSE) = 0, "Treatment Quality for Output type passed ", "Treatment Quality for Output type failed") Treatment Quality for Plant passed = =IF(COUNTIF(Treatment Quality for Output type, FALSE) = 0, " Treatment Quality Passed ", "Treatment Quality Failed")
State, Plant ULB
NA
NA
NA
NA
8
Treatment Quality Plants
Treatment Quality Failed
NA
Treatment quality is considered failed when 1 or more parameters of Biosolids or Effluents are not as per benchmarks for the output of the Treatment Process in the last test recorded.
NA
NA
NA
Count of Plants with Treatment Quality Failed
Count (Distinct PlantID) - Treatment Quality Passed
State, Plant ULB
NA
NA
NA
NA
9
Treatment Quality Plants
NA
NA
NA
Map
NA
NA
Point = Geolocation of Plant Plant Icon Colour - Green if Treatment Quality Passed, Red if Treatment Quality Failed
State, Plant ULB
NA
NA
NA
NA
Name of Plant
10
Treatment Quality Plants
NA
NA
NA
Table
NA
NA
NA
Plant Name, Test Result, Compliance %
Test Result Same as S.No 7 and S.No 8
State, Plant ULB
NA
NA
NA
NA
11
Treatment Quality Plants
NA
NA
NA
Table
NA
NA
NA
Stage, Output Type, Parameters 1...n, Compliance %
Mentioned above
State, Plant ULB
NA
Compliance %
% from last month
NA
12
Trend in [Parameter Name] Readings
NA
NA
NA
Multi-Line Chart
Test Dates
Parameter Value
- Value of Device Reading - Value of Lab results
NA
NA
Plant
NA
NA
NA
NA
Date Lab result - X Device Reading - Y
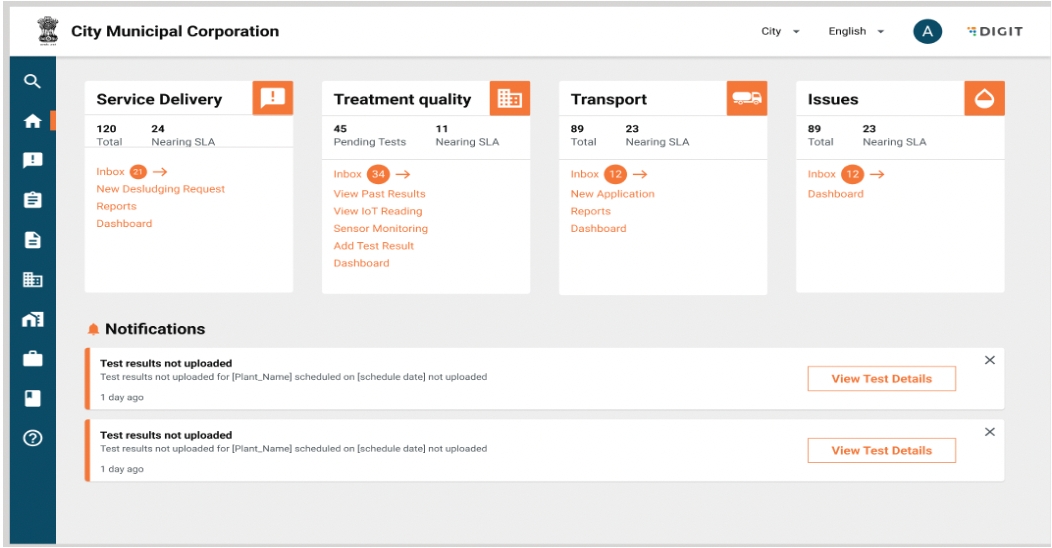
Landing Page: ULB Employee
A card for Treatment Quality Monitoring will be made available on the landing page of the employee.
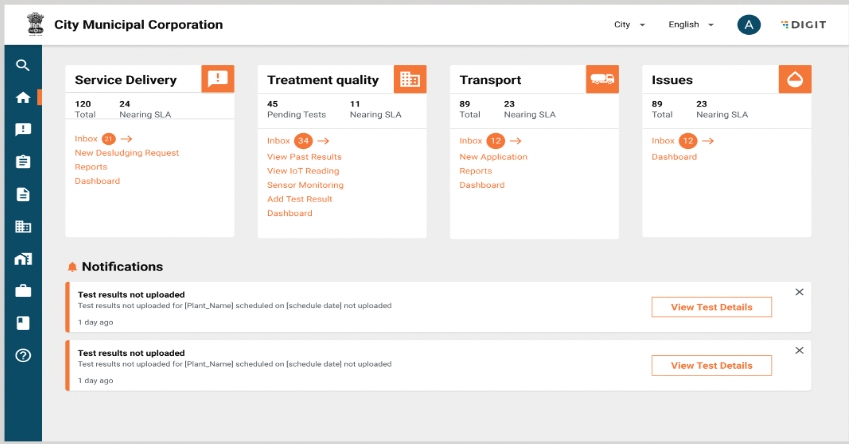
The treatment quality contain the following:
a. An overview of the total pending tests and how many are nearing SLA.
b. View upcoming tests using the inbox. The inbox will show a count of upcoming tests beside in brackets.
c. View past test results: Past results from both lab and IoT devices will be displayed here.
d. View IoT readings: The user can access the record of IoT readings here.
e. Sensor monitoring: The user can access a list of IoT devices along with their status here.
f. View dashboard: The user will be directed to the treatment quality dashboard.
Clicking on each of these links will take the user to the specific page.
Notifications: This will show the list of alerts regarding TQM. Currently, this will display the tests that have crossed SLA for greater than 7 days. The user can view the details of the test by clicking on the “View Details” button. The user can dismiss the notification by clicking on the cross button.
Rest of the functionality will remain the same as the current ULB employee landing page.
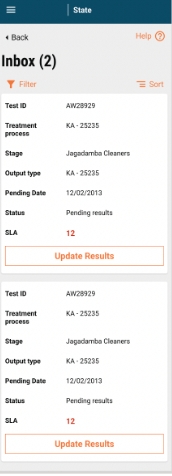
View List of Upcoming Tests
On clicking on Inbox, the user is redirected to the list of upcoming tests. This will show only a list of lab tests. The user can perform the following tasks:
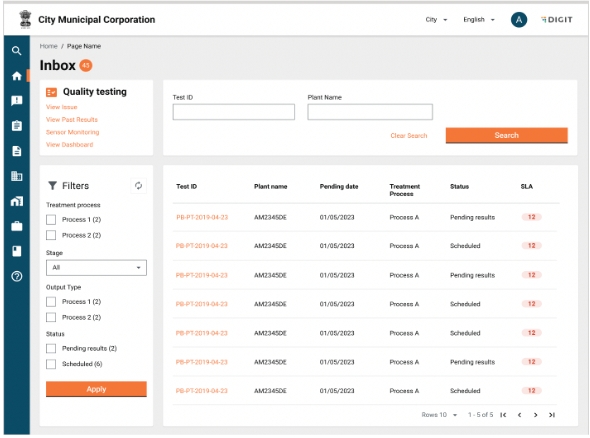
The total count of upcoming tests are displayed beside the inbox in brackets.
View a list of upcoming tests. The list of upcoming tests will be sorted by the pending date, where the test with the highest SLA is displayed first. The following fields will be displayed:
a. Test ID
b. Plant Name
c. Treatment Process
d. Pending Date: This is the test date as per schedule
e. Status: Status of the test
f. SLA: Show difference between test due date and today. This will be displayed in red if test due date<today and in green if today>test due date.
The user can view test details by clicking on the test ID.
Filter tests: Filters are displayed on the left hand panel of the screen. The following filters are available:
i. Treatment process: This will be multi-select showing values for the treatment processes configured for the ULB. The selected treatment process will be displayed as a tick on the multi-select box. If not, it is left blank.
ii. Stages: This will be a dropdown showing values for stages configured for the plant. The selected stage is displayed here on selection. If not, the field is left blank.
iii. Status: This will be a multi-select showing values for the status in the treatment quality workflow.
On selecting values for filters above, the user can click on filter to filter the inbox. To clear filters, the user can click on the refresh icon on the top right of the filter panel.
Sort: Tests can be sorted by the pending date by clicking on the date column.
Search:
a. Tests can be searched using the following:
i. Test ID.
ii. Plant Name.
b. Part search to be enabled for both.
c. Users can fill either test ID or plant or both and click on the search button.
d. Users can clear search by clicking on the clear search link.
In case filters/sort/search is applied and the user navigates to the test details page, on going back, the values of the filters/sort/search should remain the same.
Redirecting to other links in the TQM module: Users can redirect to other pages in the TQM module via the links provided on the top left of the page. The following links will be displayed:
a. View Past Results
b. View IoT Results
c. Sensor Monitoring
d. View Dashboard
View Test Details
A test details page can be accessed by clicking on the test ID in the inbox. The test details page will consist of the following fields:
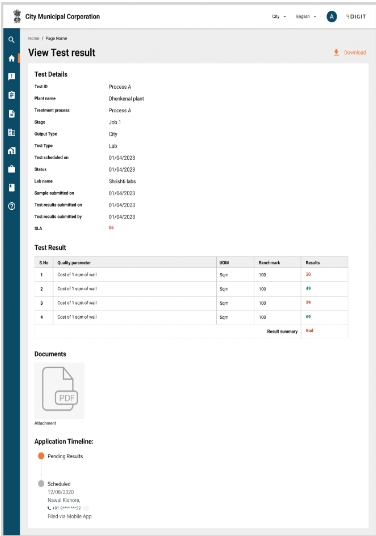
The following information will be displayed. In case the information on any field is not available such as the lab name/value against parameters based on the status of the test, the value against the fields will be displayed as “To be Updated”
- Test ID
- Plant Name
- Treatment Process
- Stage
- Output Type
- Test Type
- Test Scheduled on
- Status
- Lab Name
- Sample submitted on
- Test results submitted on
- SLA (This will be displayed in red/green based on the SLA. If today>pending date, this is red, If today<pending date, then green for open tests. For closed tests, SLA will be displayed).
- Table containing the following details:
i. S.No
ii. Parameter
iii. UoM
iv. Benchmark
v. Value Recorded - The value will be displayed in red/green based on comparison to the benchmark
vi. Overall Test results - Pass/Fail
- Attached documents, if any. The user should be able to view the document by clicking on the document icon. No icon will be present if documents are not attached.
- Test Timeline
The user can go back using the breadcrumbs of the page.
The user can download the test report by clicking on the 'Download' button.
View Past Test Results
Past test results (both IoT and Lab) can be viewed via the TQM landing page and clicking on past tests.
On clicking on past test results, the user is redirected to the list of past tests.
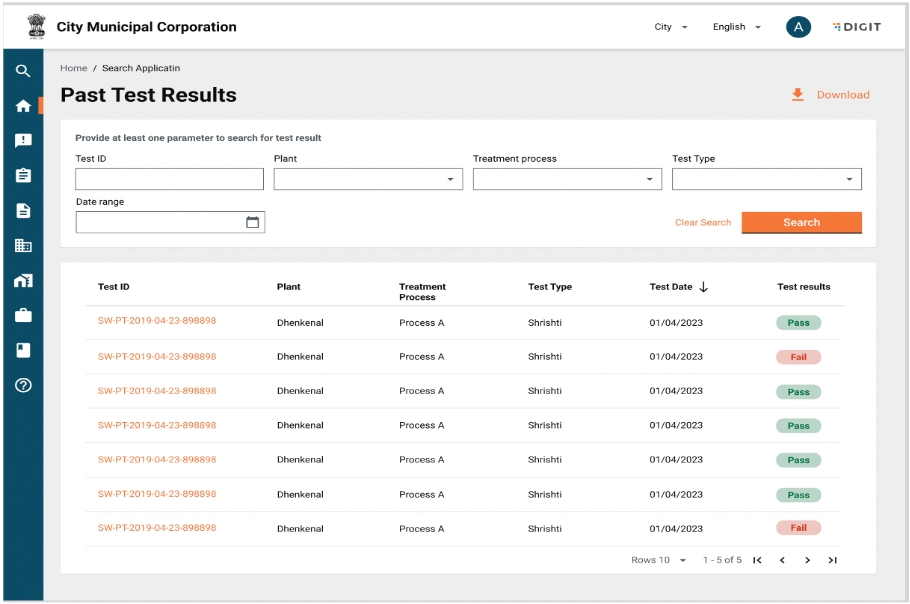
The user can perform the following tasks:
View the list of past tests. The results will be sorted on the test date. The following will be the fields displayed:
a. Test ID
b. Plant
c. Treatment Process (in case the there is only 1 treatment process for the plant, this field will not be displayed).
d. Test Type
e. Test Date: This is the date the test results are updated
f. Test Result: Pass/Fail
View test details: The user can view test details by clicking on the “Test ID” link in each row.
Search tests: The user can search based on the following:
i Test ID: Input text field, part search should be enabled.
ii. Plant: Dropdown of list of plants in the ULB.
iii. Treatment process: Dropdown of list oftTreatment Process in the ULB.
iv. Test type: This will be a dropdown showing values for the test type (IoT/Lab). The selected test type is displayed here on selection. If not, the field is left blank.
v. Date range: Selection of date range (calendar view): The selected date range is displayed here on selection. If not, the field is left blank.
On selecting values for search above, the user can click on search to filter the inbox. To clear search and view all past tests, the user can click on “Clear Search”.
Sort: Tests can be sorted by the pending date by clicking on the date column.
In case filters/sort/search is applied and the user navigates to the test details page, on going back, the values of the filters/sort/search should remain the same.
Download test results in Excel and PDF formats using the download button.
The user can go back using the breadcrumbs on the top of the page. In case the user has navigated to the test details page from the past test results list, on clicking back, the user should be redirected to the test details page.
On clicking on any test ID button, the user will be redirected to the test details page (same as redirection from the inbox).
View IoT Readings
IoT readings can be viewed via the TQM landing page and clicking on “View IoT Reading”.
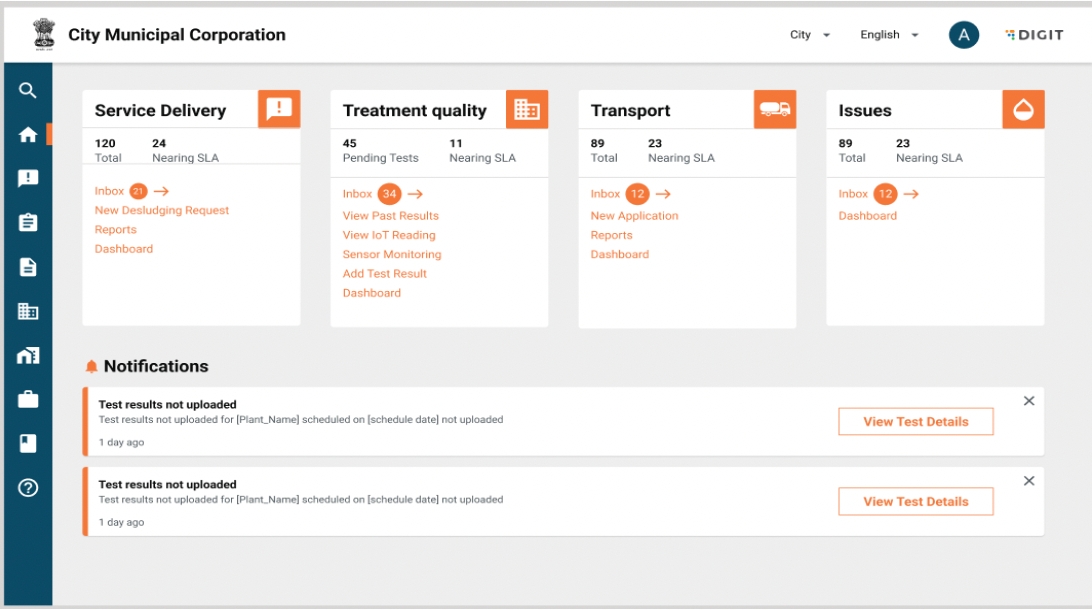
On clicking on IoT readings, the user is redirected to the list of past tests, with the search on test type selected as IoT and the results filtered for IoT readings only. All other functionality will remain the same.
Sensor Monitoring
The list of devices can be viewed via the TQM landing page and by clicking on ‘Sensor Monitoring’’.
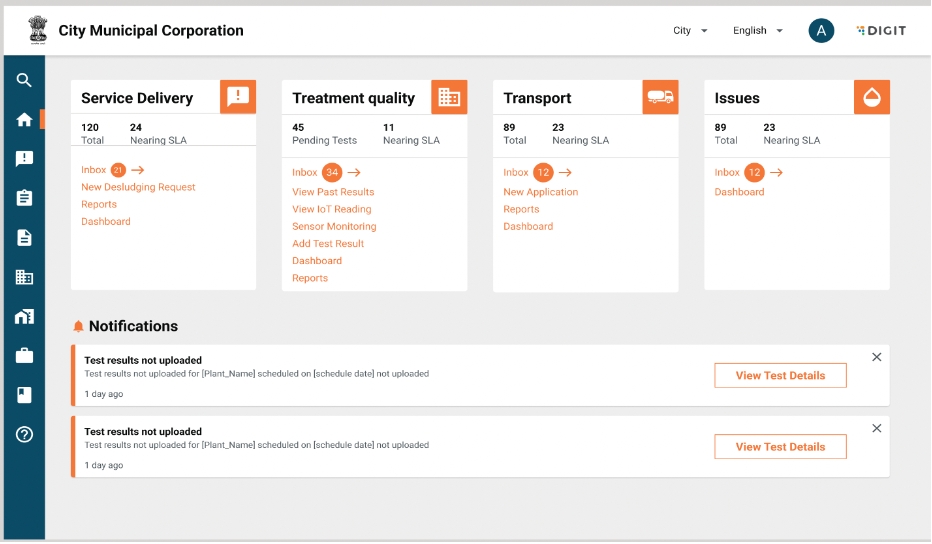
On clicking on sensor monitoring, the user is redirected to the list of devices.
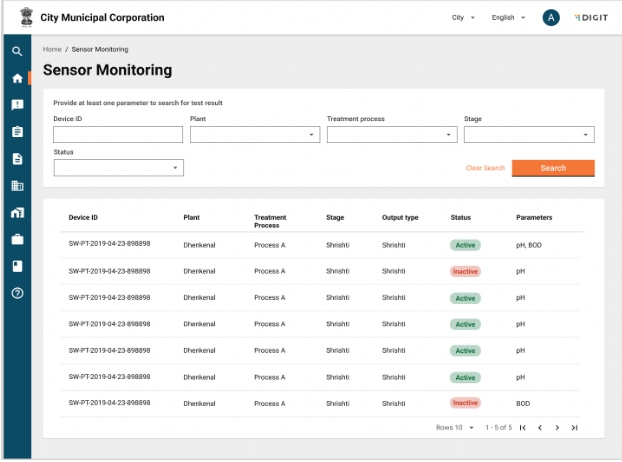
The user can perform the following:
View total devices: The total number of IoT devices is displayed beside the page heading in brackets.
A row is available for each device. The following details will be displayed:
- Device ID
- Plant
- Treatment Process
- Stage
- Output Type
- Device Status
- Parameters: One or multiple parameters that the device is monitoring.
The user can perform the following actions:
a. Search Devices: On clicking on the filter, a pop up will be displayed. The following filters are available:
Device ID: Part search should be available here.
Plant: Dropdown based on plants configured in the MDMS.
Treatment process: Dropdown-based on the treatment process type.
Stage: Dropdown-based stage of selected treatment process.
Output type: This will be a drop down showing values for Output types configured for the plant.
Device status: Dropdown contains active/Inactive as options.
b. On selecting values for filters above, the user can click on Search to filter the inbox.
c. To clear search, the user can click on clear all.
Record Test Result
Since actors such as PCB might conduct adhoc tests, a provision will be provided to the user to record test results without a schedule. A user can record test results by clicking on the “Add Test Result” link on the card.
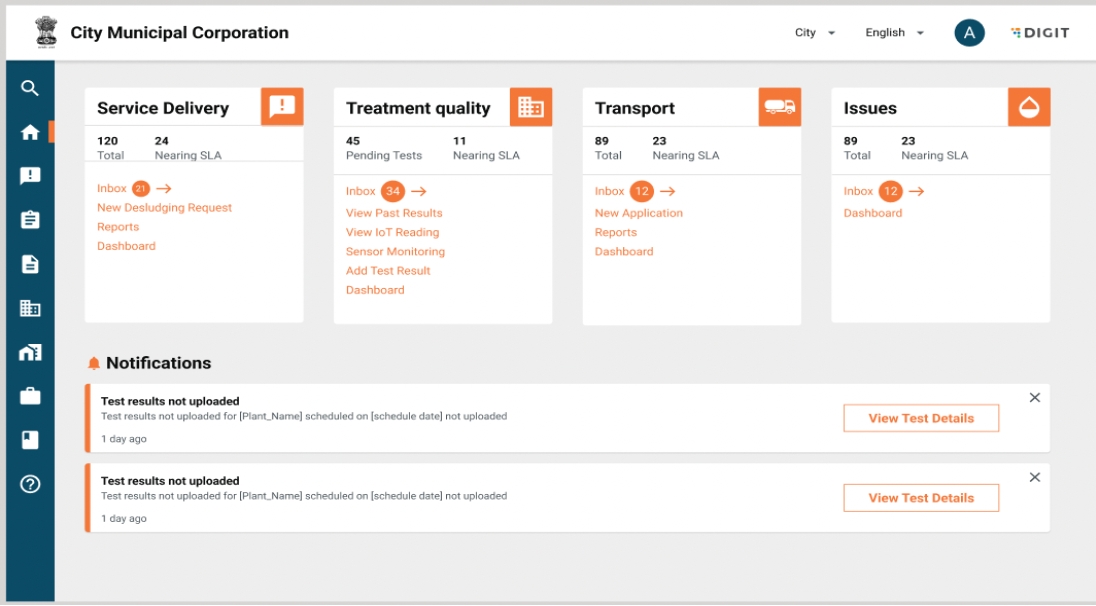
Clicking on the “Add Test Result” button will redirect the user to the “Add Test Result” page.
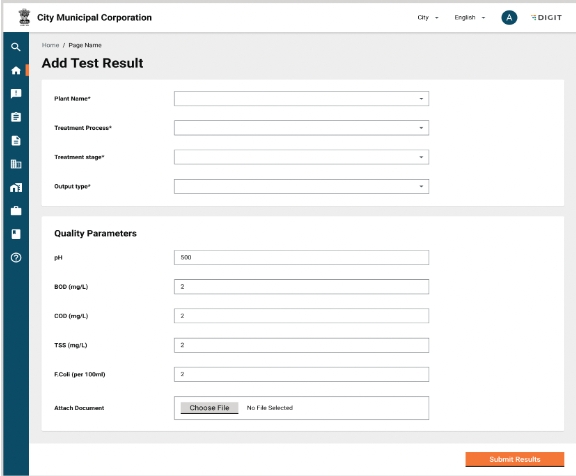
The following fields need to be entered by the user:
Plant Name: This is a dropdown based on the list of plants available in the system. For a state level user, this should display all plants in the state. For a ULB, it should also display the names tagged to the ULB.
Treatment Process: This is a dropdown based on the list of treatment processes in the plant selected.
Treatment Stage: This is a dropdown based on the list of stages in the treatment process selected.
Output Type: This is a dropdown based on the output types available in the stage
Values against parameters. Atlease 1 parameter needs to be filled for the submit button to be enabled. If no parameter is filled and the user clicks on the submit button, an error message is displayed as a snack bar.
Attachments, if any.
Once the user clicks on the Submit button, the test results page is displayed.
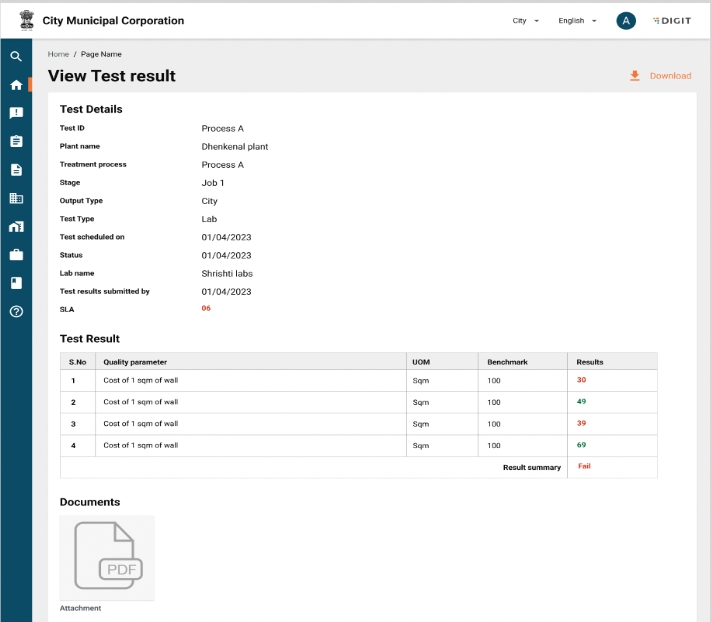
This is the same as the “View Test Results” page with the following changes:
TesttType will be displayed as Lab.
Status, lab name and SLA field are not displayed.
Workflow will not be displayed.
The user can go back to the “Add Test Results” page via the breadcrumbs.
View Dashboard
The TQM Dashboard will be made available to both the ULB employee and the state employee, and can be accessed by clicking on the dashboard link on the landing page.
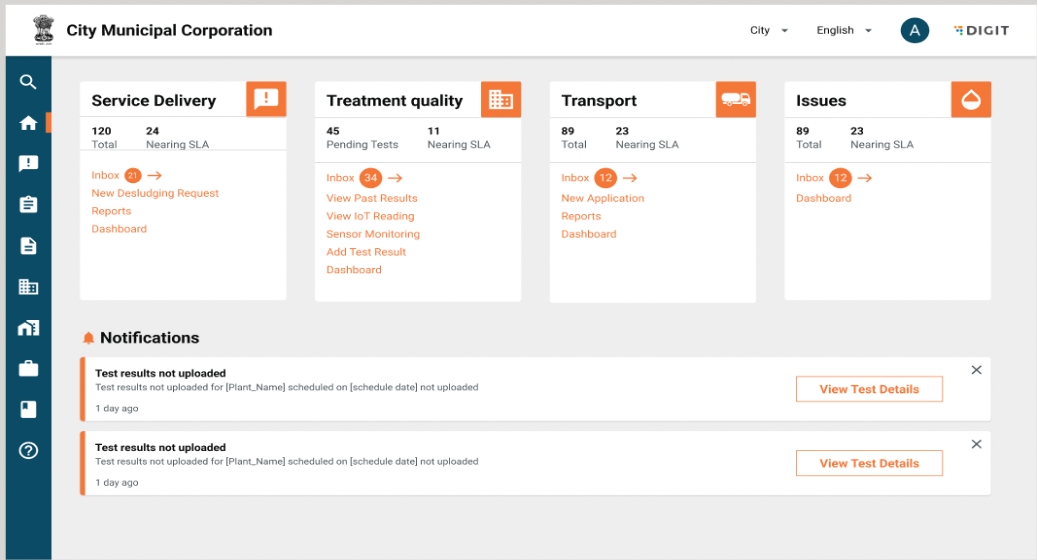
On clicking on the dashboard, the user is directed to the dashboard view.
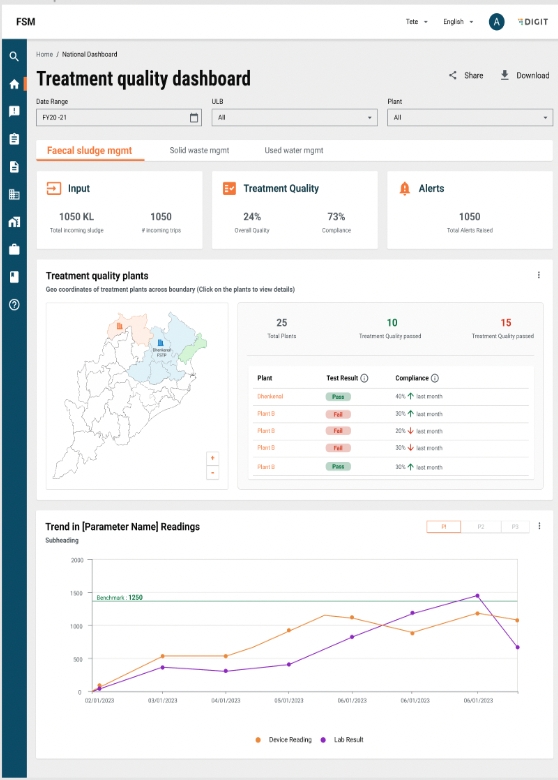
The access to data in the dashboard will be based on the following roles:
ULB admin will be able to view the dashboard for all plants in the ULB.
A state admin will be able to view the dashboard for all plants in the ULB.
Navigation:
On landing on the dashboard, the user can navigate across the treatment process types to view the dashboard specific to the treatment process type.
Filters:
Date range: Users should be able to filter based on the date range.
ULB: Users should be able to filter based on the ULB. For a ULB employee, the ULB is auto-selected to the ULB the plant and employee is tagged to. For a state user, all ULBs are available.
Plant: Users should be able to filter based on the plant. For ULB employees, plants tagged to the ULB to which the employee belongs should be available in the dropdown. For state users, all plants are available.
Other functionalities:
Share:
- Users should be able to share a filtered dashboard over WhatsApp in an image format.
- Users should be able to share filtered charts/tables over WhatsApp in an image format.
Download:
- Users should be able to download the filtered dashboard in PDF and image formats.
- Users should be able to download the filtered charts/tables in PDF and image formats.
Metrics
Overall KPIs:
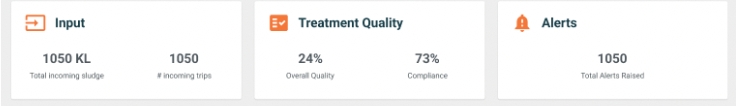
The dashboard will display the following KPIs:
Total incoming sludge: The sum of the total sludge that is disposed of at the plant for the selected time period.
Number of trips: A count of total incoming vehicles at the treatment plant for the selected time period.
Overall quality: The number of tests where all parameters are as per benchmarks as compared to the total number of test results recorded.
Compliance percentage: The percentage of tests where results have been recorded
Total alerts: A Count of total alerts raised of the following types: Test results not as per benchmark, the number reading from IoT device, and lab results and IoT results not matching.
Treatment quality overview:
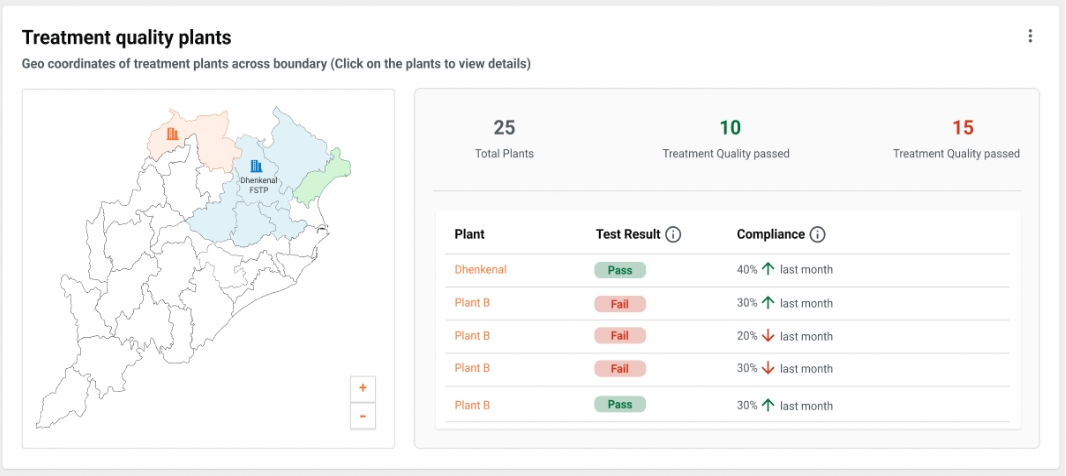
KPIs:
Total plants - A count of the unique plants for the particular treatment process.
Count of plants who have passed the treatment quality as per the last recorded test.
Count of plants who have failed the treatment quality as per the last recorded test.
Treatment quality is said to have passed if all parameters for final output(s) of a treatment process are as per benchmarks. Treatment quality is said to have failed if 1 or more parameters for final output(s) of a treatment process is not as per benchmarks.
Map:
A map view of the location of each plant will be displayed as part of the dashboard. Plants here will be colour coded, based on whether it has passed/failed the treatment quality. (Red = failed, Green = passed).
Table:
A table will be available to plant-wise details of test results (pass/fail), and the compliance percentage. This will be as per the last test result. The user will also be able to see a change in compliance percentage compared to the last month. A drilldown will be made available for a plant via this table. For TRP users and ULBs, where only 1 plant is tagged for the process type, the drilled table is automatically visible.
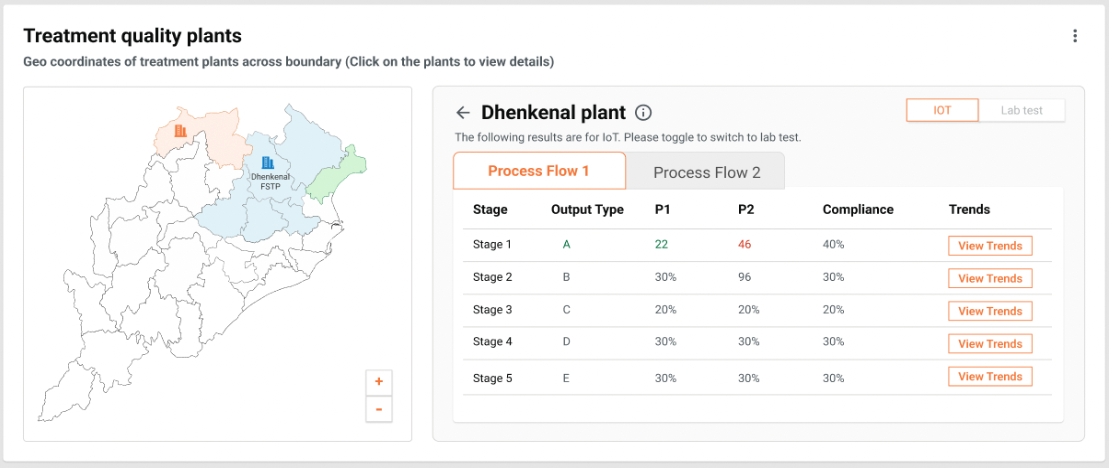
On drilldown, the following is viewable to the user:
Heading - Name of plant.
Table displaying the following fields:
a. Stage, output type, value of parameters, and compliance percentage.
b. Button to view the trends for a particular stage.
Toggle to toggle between IoT readings and lab results.The selected test type will appear highlighted.
If there are multiple process flows, then the user can switch between process flows by using the buttons. The selected process flow will appear highlighted.
Trends of parameter readings:
This chart will be available once the user clicks on the view trend button in the table button.
The table shows the trend for one parameter over time and provides a view of the benchmark for comparison. A toggle is available to navigate between parameters.
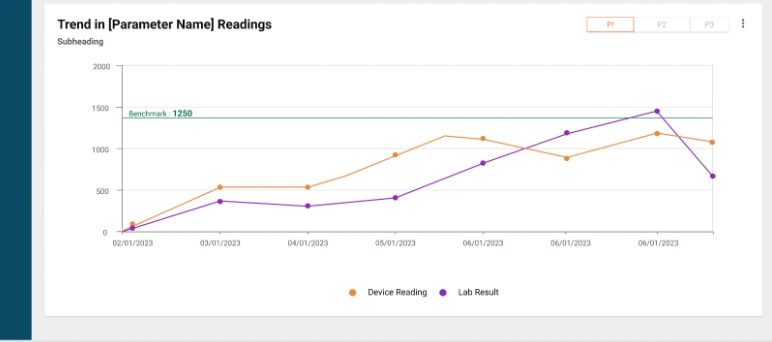
Out of Scope
The following is out of scope:
Testing for parameters beyond those defined for a plant. If testing needs to be recorded for an additional parameter, these need to be configured for a plant first before testing can be performed.
Verification of test result documents uploaded by the user: While the system will mandate the user to upload the test result document, verification of the document and ensuring correctness of the information recorded is not in scope.
There is some initial uptake in the market for mobile treatment units, which bring treatment onsite to the citizen. Here treatment is done within the mobile treatment unit. We are unaware of how this technology works in terms of recording and storing treatment quality and hence this is out of scope.
Editing test results once recorded by the user in case of manual testing.
Editing IoT device readings.
Recording of the data trail in cases when testing parameters have been added/deleted/updated.
Testing parameters may be changed at any point. However, test schedules may already be generated and testing will be done based on old parameters defined when the test schedule is generated.
No tracking of reason if test results are not recorded as per schedule.
In case a schedule for a test is available, but the user fills the test results directly via the “Record Result” page, this will not be adjusted.
Escalation in case of non-compliance to the testing schedule will be done once per test. If test results are still not recorded, no further action will be taken.
UI for defining testing requirements and adding/disabling/editing testing parameters.
As per our field study, one plant has only one treatment process per treatment process type. The dashboard does not cover calculations for a plant that may have 2 processes for the same treatment process type. For example, For faecal sludge, the plant will either run an aerobic or an anaerobic process and not 2 process flows, one for aerobic and one for anaerobic.
Activating/deactivating IoT devices from the frontend.
Assumptions
Theme
Assumption
Testing Parameters and Standards
Testing parameters are a defined set for a particular process type, stage and input/output type combination, and so do not vary at a high frequency. Hence, they can be configured in the MDMS.
Testing
1 user will be responsible for managing the treatment quality of 1 plant for a process type.
Multiple parameters at one stage of a plant with the same testing frequency are tested together and monitored as one test.
Governing bodies such as the PCB perform adhoc tests, and will use the system to create a record of the results for the same.
Anomaly Detection
For a test result containing multiple parameters, if 1 parameter is not as per benchmark, we can categorise the test results as not as per benchmarks
Since IoT readings will be captured at high frequency, anomalies will be generated only if the test value for a parameter is not as per benchmarks for [X] days.
IoT Integration
A standard adaptor will be made available for IoT integration. However, the adaptor may need to be modified on a case basis during implementation.
Reference Policies
Effluent Parameters
While each state is free to monitor the parameters applicable in their context, the platform mandates MOEFCC’s October 13, 2017 Notification as the minimum requirement for effluent quality monitoring.
Parameter
Unit
Value Range
Location
pH
-
6.5 - 9
Anywhere
BOD
mg/L
20
Metro Cities and all State Capitals except in the State of Arunachal Pradesh, Assam, Manipur, Meghalaya Mizoram, Nagaland, Tripura Sikkim, Himachal Pradesh, Uttarakhand, Jammu and Kashmir and Union Territory of Andaman and Nicobar Islands, Dadar and Nagar Haveli Daman and Diu and Lakshadweep
30
Other areas
TSS
mg/L
< 50
Metro Cities and all State Capitals except in the State of Arunachal Pradesh, Assam, Manipur, Meghalaya Mizoram, Nagaland, Tripura Sikkim, Himachal Pradesh, Uttarakhand, Jammu and Kashmir and Union Territory of Andaman and Nicobar Islands, Dadar and Nagar Haveli Daman and Diu and Lakshadweep
< 100
Other areas
F. Coliform
N/100mL
< 1000
Anywhere
COD
mg/L
(?)
*Metro Cities are Mumbai, Delhi, Kolkata, Chennai, Bengaluru, Hyderabad, Ahmedabad, and Pune.
During implementation, these will be setup by the system integrators as per the state policy.
Biosolids Parameters
Regulations for biosolids are unclear - we currently don't have a definitive GoI-notified standard for faecal sludge-derived biosolids. The Advisory and Primer on FSSM (along with the CPHEEO Manual) recommended US EPA Class A Biosolids criteria (looking at E Coli/F Coli, Salmonella, Helminth Eggs). The National Policy on FSSM issued after all these three makes mention of SWM Rules, 2016, as the guiding document for processed sludge quality.
Taking from the Quality in Faecal Sludge Management (Benchmarks, Standards, and Specifications) by NFSSMA and Plain English Guide Part 503 Biosolids Rule, SWM Rules 2016, the platform mandates minimum parameters as listed below, while keeping the flexibility for the States to choose or add as per its context.
Parameter
Unit
Value Range
Temperature
Degree Celsius
(?)
Moisture
Percentage
(?)
E.Coli
OR
F. Coli
MPN
< 1000 MPN (E-coli)/g Total solids
OR
< 1000 CFU (Faecal coliform)/g Total solids by dry weight)
Heavy metals (Arsenic, cadmium, chromium, copper, lead, mercury, nickel, zinc)
grams
(?)
Medical Waste: Brazil
The following are the acceptable parameters for medical waste according to Brazilian Standard NBR:
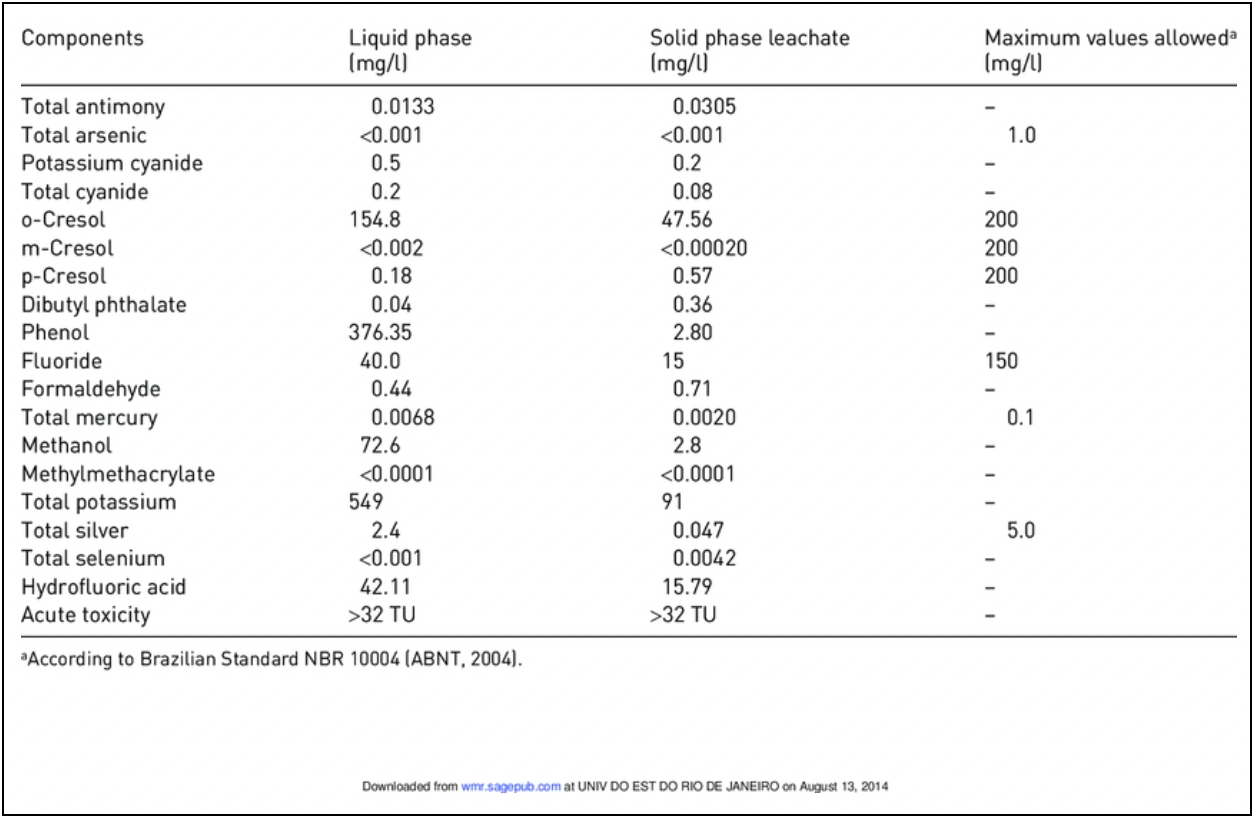
Was this helpful?