
User Interface Design
Exemplar
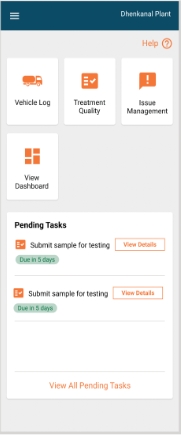
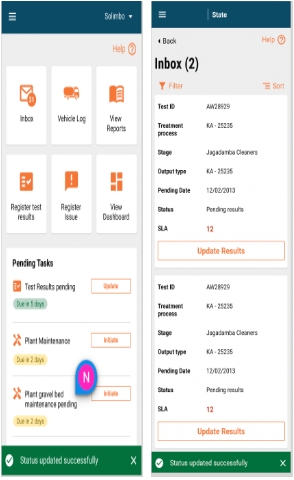
Landing Page: Plant Operator
The user will land on the home page post login. The following actions can be performed by the user:
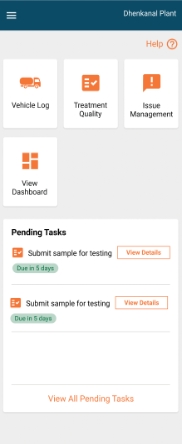
The plant name is visible on the top right hand corner of the screen.
A help button is available for the user to get a guided view of the page. This is available on every page.
Cards are viewable for the following modules:
a. Vehicle log module (record incoming vehicles)
b. Treatment quality module
c. View dashboard
Clicking on each of these cards will take the user to the Homepage for the specific module.
List of pending tasks: This will show the list of tests pending within the next [X] days. The next action item in the task workflow will be displayed beside a pending task for a user to take prompt action. A button for “View All Pending Tasks” will be displayed which will redirect the user to “All Pending Tasks”.
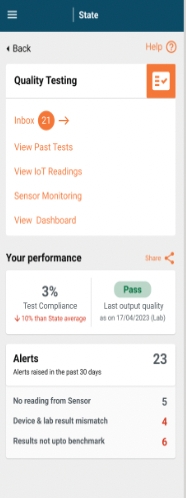
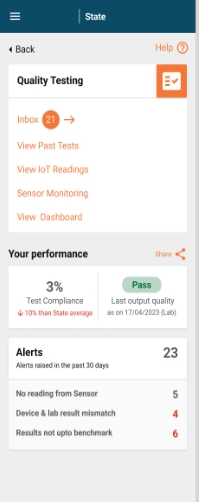
Treatment Quality Module (TQM) Home Page
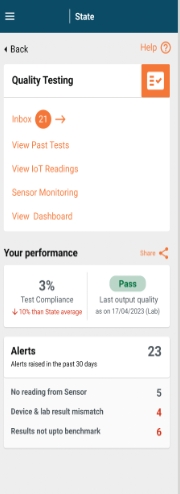
On clicking on the treatment quality card, the user is redirected to the TQM home page. The following actions can be performed by the user:
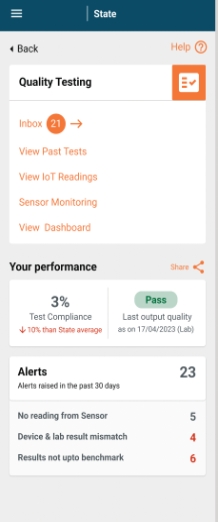
View and take action on upcoming tests using the inbox. The inbox will show a count of upcoming tests beside it.
View past test results: Past results from both lab and IoT devices will be displayed here.
View IoT readings: The user can access the record of IoT readings here.
Sensor Monitoring: The user can access a list of IoT devices along with their status here.
View dashboard: The user will be directed to the treatment quality dashboard.
View performance: This widget will show the performance of the plant in regards to treatment quality and will display the following KPIs:
a. Test compliance: Compliance percentage of plant with regards to the treatment quality and its comparison to state level compliance percentage.
b. Last treatment quality result - Pass/fail and date of the test.
c. Count of alerts raised in the past 30 days.
d. Distribution of alerts based on the alert category.
Go back to the Landing page using the back button.
A help button is available for the user to get a guided view of the page. This is available on every page.
View List of Upcoming Tests
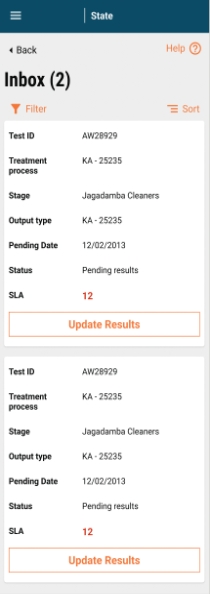
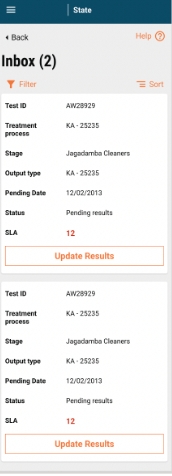
On clicking on inbox, the user is redirected to the list of upcoming tests. This will show only a list of lab tests. The user can perform the following tasks:
Total count of upcoming tests are displayed beside the inbox in brackets.
View list of upcoming tests. The following will be the fields displayed:
Total count of upcoming tests are displayed beside the inbox in brackets.
View list of upcoming tests. The following will be the fields displayed:
a. Test ID.
b. Treatment process (in case there is only 1 treatment process for the plant, this field will not be displayed).
c. Stage: This will display the process stage where the sample is to be collected from.
d. Output type: Biosolids/effluents.
e. Pending date: This is the test date as per schedule.
f. Status: status of the test.
g. SLA: Show difference between test due date and today.
An action item available based on the next status in the workflow will be displayed:
a. For test results in the scheduled stage, update status will be displayed.
b. For tests in the pending results stage, update results will be displayed.
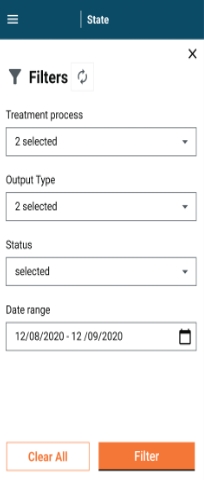
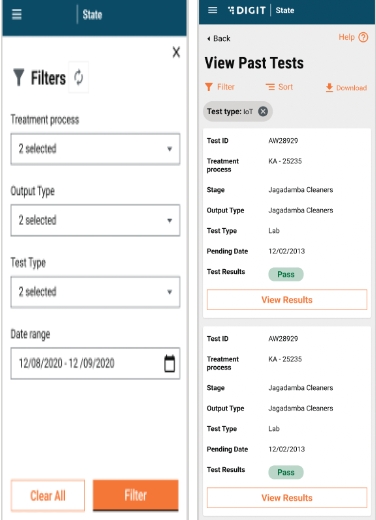
Filter tests: On clicking on filter, a pop-up will be displayed:
a. The following filters are available:
Treatment process: (In case there is only 1 treatment process for the plant, this field will not be displayed). This will be a dropdown showing the values for treatment processes configured for the plant. The selected treatment process is displayed here on selection. If not, the field is left blank.
Output type: This will be a dropdown showing values for output types configured for the plant. The selected output type is displayed here on selection. If not, the field is left blank.
Status: This will be a dropdown showing values for the status in the treatment quality workflow. The selected status is displayed here on selection. If not, the field is left blank.
Date range: Selection of date range (calendar view): Selected date range is displayed here on selection. If not, the field is left blank.
b. On selecting values for the filters above, a user can click on filter to filter the inbox.
c. To clear filters, a user can click on clear all.
d. To close the pop-up, a user can click on the cross on the top right hand corner of the screen.
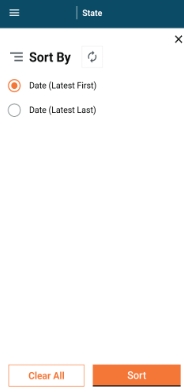
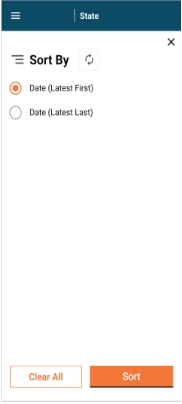
Sort: On clicking on sort, a pop-up will be displayed:
a. Tests can be sorted by the pending date:
Date (Latest first)
Date (Latest Last)
b. On selecting values for sort above, the user can click on sort to sort the inbox.
c. To clear sort, a user can click on clear all.
d. To close the pop-up, a user can click on the cross on the top right hand corner of the screen.
Go back to the landing page using the back button.
A help button is available for the user to get a guided view of the page. This is available on every page.
View Test Details
Test Details can be viewed by the user in 2 ways:
Via the pending tasks.
Via inbox.
View Test Details Via Pending Tasks
The list of pending tasks can be accessed via the landing page for TQM. This will show the list of tests pending within the next [X] days.
The next action item in the task workflow will be displayed as a button beside a pending task for a user to take prompt action. On clicking on the button, the user will be redirected to the test details page.
View Test Details Via Inbox
A list of tests can be accessed on the inbox. An action item is available based on the next status in the workflow will be displayed:
For test results in the scheduled stage, the update status will be displayed.
For tests in the pending results stage, the update results will be displayed.
On clicking on the action item, the user will be redirected to the test details page.
The test details page will consist of 2 cards:
The first card will display the following fields:
Test ID
Treatment Process
Stage
Output Type
Pending Date
Status
Parameters to be tested along with their unit of measurement
SLA (This will be displayed in Red/green basis SLA. If today>Pending date, this is red, If today<pending date, then green).
The second card will be based on the test status:
For tests in status ‘Scheduled’, the user will be asked to select a lab.
For tests in status “Pending Results”, the user will be asked to add test results
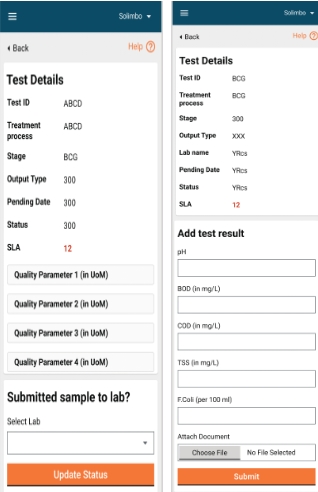
The user can go back using the back button - The redirection will be based on the page the user has accessed the test details page from. A help button is available for the user to get a guided view of the page. This is available on every page.
Update Tests
Tests can be updated by the user from the test details page. The test details page will display the next action item for the user based on the workflow test. For tests with the wWorkflow status ‘Scheduled’, the user will be prompted to confirm if sample has been submitted to the lab for testing.
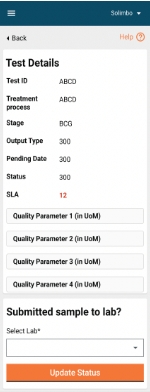
The user can perform the following actions:
Select a lab from a dropdown list configured in the MDMS.
Update status of the test. The button will be deactivated if Lab is not selected, and will only be activated once selection is made. Once the user clicks on update status, he/she is redirected back to the page from which test details were accessed and a snack bar confirms the status update and the action Item button shows updated next step.
In case an update of status fails, the user will remain on the same page and a failure message will be displayed to the user.
For tests with the workflow status “Pending Status”, the user will be prompted to fill test results.
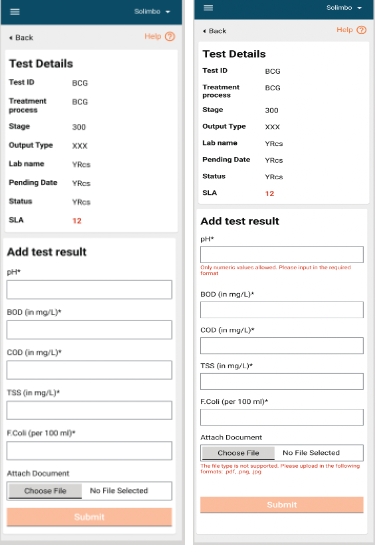
The user can perform the following actions:
Update parameter readings (mandatory fields) The following validations will be applied:
a. Only numerical values will be viewable here. In case of non numerical values, the following error message is displayed “Only numeric values allowed. Please input in the required format”.
Attach documents (non-mandatory): The following validations will be applied:
a. Only files in the following formats will be supported: .png, .jpg. .pdf. In case a file of unsupported format is selected, the following error will be displayed “The file type is not supported. Please upload in the following formats: .pdf, .png, .jpg”.
b. File size of maximum X mb allowed. In case file size is larger than permitted value, the following error will be displayed “The file size is too large. Please upload a file below x mbs”.
Submit test results by clicking on the ‘Submit’ button. The button will be deactivated if all is not selected, and will only be activated once selection is made. On clicking the submit button, a pop-up will be displayed to the user to confirm submission.
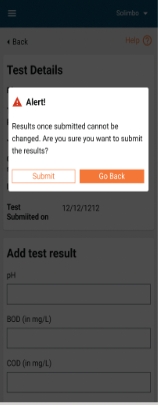
The following actions will be made available to the user:
Confirm submission by clicking on the ‘Submit’ button.
Go back to the test details page by clicking on the “Go back” button.
On clicking the submit button and failure to submit test results, the user will remain on the same page and a failure message will be displayed.
On clicking the submit button and successful submission of the test results, the user will be redirected to the summary page and a snack bar will confirm the submission.
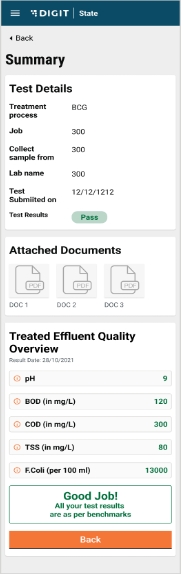
At this stage, the user will be displayed the summary of test results and whether it has passed/failed based on a comparison between the values entered by the user and the benchmarks. In case all values are as per the benchmarks, the test results will be displayed as ‘Pass’. All values will be shown in green and the user receives feedback that all results are as per benchmarks. The user can go back to the home page by clicking on the ‘Back’ button.
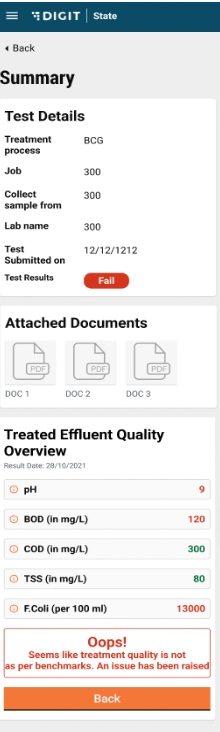
In case one or more values are not as per the benchmarks, the test results will be displayed as ‘Fail’. All values as per benchmarks will be shown in green. Values not as per the benchmarks are shown in red. The user is provided with information that the test results are not as per benchmark. The user can go back to the Home page by clicking on the ‘Back’ button.
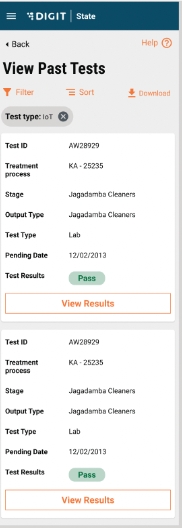
View Past Test Results
Past test results (both IoT and Lab) can be viewed via the TQM landing page and by clicking on past tests.
On clicking on past tests, the user is redirected to the list of past tests.
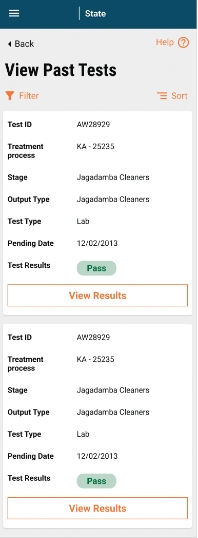
The user can perform the following tasks:
View the list of past tests. The following will be the fields displayed:
a. Test ID.
b. Treatment process (in case there is only 1 treatment process for the plant, this field will not be displayed).
c. Stage: This will display the process stage where the sample is to be collected from.
d. Output type: Biosolids/effluents
e. Pending date: This is the test date as per schedule.
f. Test result: Pass/fail.
2. View test details: The user can view test details by clicking on “View Results” button on each card.
Filter tests: On clicking on Filter, a pop-up will be displayed. The following filters are available:
i. Treatment process: (in case there is only 1 treatment process for the plant, this field will not be displayed). This will be a dropdown showing values for Treatment Processes configured for the plant. The selected treatment process is displayed here on selection. If not, the field is left blank.
ii. Output type: This will be a dropdown showing values for the output types configured for the plant. The selected output type is displayed here on selection. If not, the field is left blank.
iii. Test type: This will be a dropdown showing values for the test type (IoT/Lab). The selected test type is displayed here on selection. If not, the field is left blank.
iv. Date range: The selection of date range (calendar view) - The selected date range is displayed here on selection. If not, the field is left blank.
On selecting values for filters above, the user can click on filter to filter the inbox. To clear filters, the user can click on clear all. To close the pop-up, a user can click on the cross on the top right hand corner of the screen. On selection of the filter, the selected filter is displayed on the screen. On clicking the cross button near the displayed filter, the filter is removed.
Sort: On clicking on sort, a pop-up will be displayed:
a. Tests can be sorted by the pending date:
Date (Latest first)
Date (Latest last)
b. On selecting values for sort above, the user can click on sort to sort the inbox.
c. To clear sort, the user can click on clear all.
d. To close the pop-up, the user can click on the cross on the top right hand corner of the screen.
In case filters/sort/search is applied and the user navigates to the test details page, on going back, the values of the filters/sort/search should remain the same.
The user can download the list of tests, filtered by selection in Excel and PDF format.
Go back to the Landing page using the back button.
A help button is available for the user to get a guided view of the page. This is available on every page.
On clicking the “View Results” button, the user will be redirected to the test summary page.
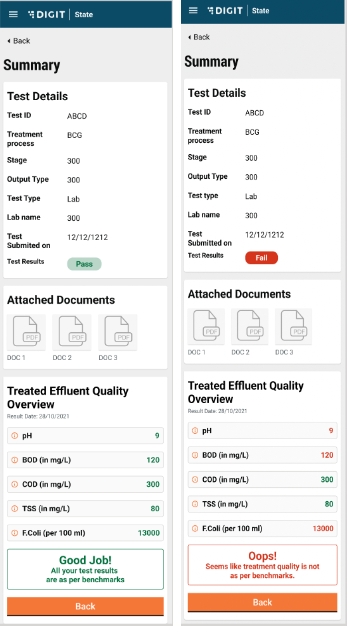
The page will have 2 cards:
The first card will display the following fields:
Test ID.
Treatment Process.
Stage.
Output Type.
Test Type.
Lab Name/Device ID: This will show Lab Name/Device ID based on the Test type.
Test submitted on.
Test Results: Pass/Fail.
The second card will display the following fields:
Parameters, their unit of measurement and the values of the parameters recorded. The values will be read/green basis whether they are as per benchmarks or not.
The user can go back to the list of tests by clicking on the ‘Back’ button, both on the top and bottom of the page.
View IoT Readings
IoT readings can be viewed via the TQM landing page and clicking on view IoT readings.
On clicking on View IoT readings, the user is redirected to the view tests page filter on test type: IoT.
The functionality of the page remains the same as the “View Past Tests” page.
Sensor Monitoring
Sensor monitoring can be accessed by clicking on the sensor monitoring link on the TQM landing page.

On clicking on sensor monitoring, the list of IoT devices are displayed.
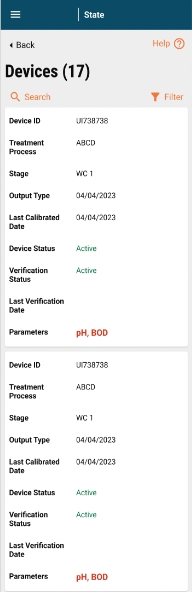
The following details are displayed on the page:
Total number of IoT devices is displayed beside the page heading in brackets.
A card is available for each device. The following details will be displayed:
- Device ID.
- Treatment Process.
- Stage.
- Output Type.
- Last Calibrated Date.
- Device Status.
- Verification Status.
- Last Verification Date.
- Parameters that the device monitors.
The user can perform the following actions:
Filter devices: On clicking on filter, a pop-up will be displayed.
a. The following filters are available:
i. Treatment process: (in case there is only 1 treatment process for the plant, this field will not be displayed). This will be a dropdown showing values for the treatment processes configured for the plant. The selected treatment process is displayed here on selection. If not, the field is left blank.
ii. Output type: This will be a dropdown showing values for the output types configured for the plant. The selected output type is displayed here on selection. If not, the field is left blank.
iii. Device status: This will be a radio button showing active/inactive
iv. Parameters: This will be a multi-select displaying all parameters configured on the backend.
b. On selecting values for filters above, the user can click on filter to filter the inbox.
c. To clear filters, the user can click on clear all.
d. To close the pop up, the user can click on the cross on the top right hand corner of the screen.
e. On selection of the filter, the selected filter is displayed on the screen. On clicking the cross button near the displayed filter, the filter is removed.
Search: On clicking on search, a pop-up will be displayed.
a. The user can search a device by device ID. Part search to be enabled.
View Dashboard
Dashboards can be accessed by clicking on the “View Dashboards” link on the TQM landing page.
Navigation:
On landing on the dashboard, the user can navigate across the treatment process types to view the dashboard specific to the treatment process type.
Filter:
Date range: Users should be able to filter based on the date range basis which dashboard is to be filtered.
Other functionalities:
Share:
Users should be able to share a filtered dashboard over WhatsApp in an image format.
Users should be able to share filtered charts/tables over WhatsApp in an image format.
Download:
Users should be able to download the filtered dashboard in PDF and image formats.
Users should be able to download filtered charts/tables in PDF and image formats.
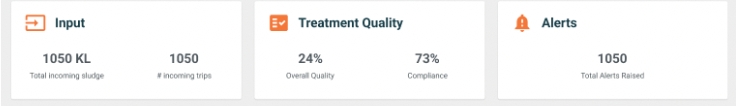
Metrics:
Total incoming sludge: The sum of the total sludge that is disposed of at the plant for the selected time period.
Number of trips: A count of the total incoming vehicles at the treatment plant for the selected time period.
Overall quality: The number of tests where all parameters are as per the benchmarks as compared to the total number of test results recorded.
Compliance percentage: The percentage of tests where results have been recorded.
Total alerts: A count of the total alerts raised of the following types: Test results not as per the benchmark, no reading from the IoT device, and lab results and IoT results not matching.
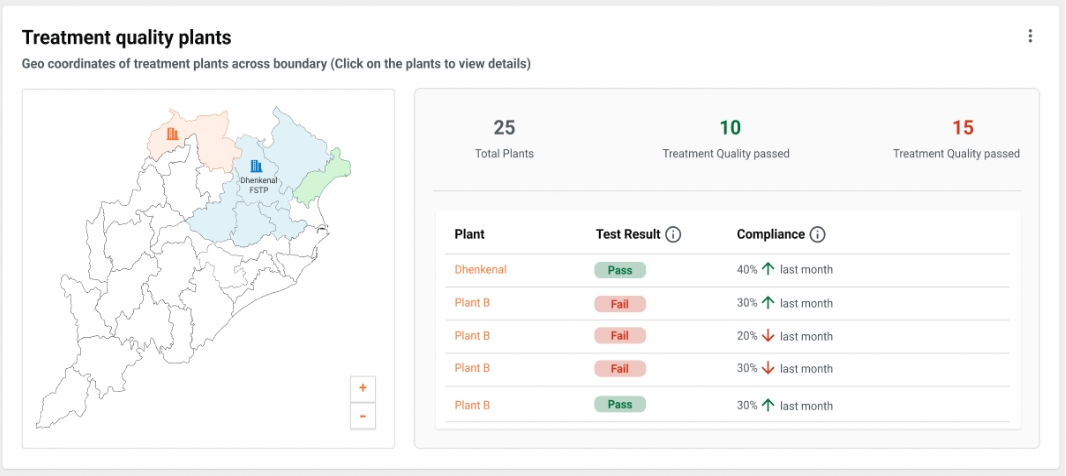
Treatment Quality Overview:
KPIs:
Total tests - A count of the total tests for the filtered date range.
A count of tests that have passed treatment quality.
A count of tests that have failed the treatment quality.
Table:
Heading - Name of the plant.
Table displaying the following fields:
a. Stage, output type, value of parameters, and compliance percentage.
b. Button to view the trends for a particular stage.
Toggle to toggle between IoT readings and lab results.
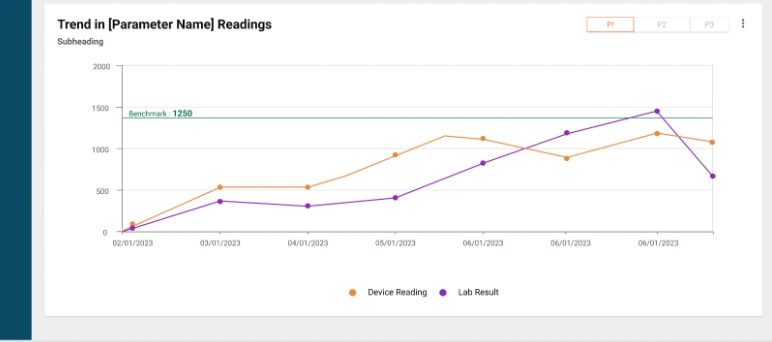
Trends of parameter readings:
This chart will be available once the user clicks on the view trend button in the table button.
The table shows the trend for one parameter over time, and provides a view of the benchmark for comparison. A toggle is available to navigate between the parameters. Detailed metric details for the Treatment Quality Monitoring dashboard are viewable below:
Section Heading
Chart Heading
Subheading
Definitions ((This will appear on the dashboard whenever a user hovers on the metric wherever applicable))
Chart Type
X-Axis
Y-Axis
Value
Columns
How to calculate
Boundary
Dtill down/Toggle
Comparsion KPIs, if any
Show comparison in
Specific to State/ULB/ TRP/all
Tooltip on Hover on Data Point
Input Fields
1
Input
Total Incoming Sludge
NA
Total Incoming sludge from registered and unregistered vehicles
KPI
NA
NA
Total Incoming Sludge
NA
Total incoming sludge = (Volume of Waste Disposed for Registered Vehicles) + (Volume of Waste Disposed for Unregistered Vehicles)
State, Plant ULB
NA
NA
NA
NA
2
Input
# incoming trips
NA
Number of trips disposed at the Treatment plant
KPI
NA
NA
Count of Trips to the Treatment plant from registered and unregistered vehicles
NA
Number of trips disposed = Count(DISTINCT Trip ID)
State, Plant ULB
NA
NA
NA
NA
3
Treatment Quality
Overall Quality
NA
% of tests where all parameters are as per benchmarks
KPI
NA
NA
% of test results meeting benchmarks
NA
Overall Quality = (Number of tests where all parameters meet benchmarks / Total number of tests) * 100
State, Plant ULB
NA
NA
NA
NA
4
Treatment Quality
Compliance
NA
% of tests where results have been recorded
KPI
NA
NA
% of tests with Status as submitted out of total tests
Compliance % = (Count of Test ID in status 'Submitted' / Count (Distinct Trip ID) * 100
State, Plant ULB
NA
NA
NA
NA
5
Alerts
Total Alerts
NA
Total Alerts raised by the system in the following categories: 1) Test Results not as per benchmark 2) No reading from IoT device 3) Lab results and IoT results not matching
KPI
NA
NA
Total Alerts
Count(DISTINCT AlertID)
State, Plant ULB
NA
NA
NA
NA
6
Treatment Quality Plants
Total Plants
NA
NA
NA
NA
NA
Count of Plants
Count (Distinct PlantID)
State, Plant ULB
NA
NA
NA
NA
7
Treatment Quality Plants
Treatment Quality Passed
NA
Treatment quality is considered passed if all parameters of both Biosolids and Effluents are as per benchmarks for the output of the Treatment Process in the last test recorded.
NA
NA
NA
Count of Plants with Treatment Quality Passed
Treatment Quality for Output type =IF(COUNTIF(All Parameters Meet Benchmarks, FALSE) = 0, "Treatment Quality for Output type passed ", "Treatment Quality for Output type failed") Treatment Quality for Plant passed = =IF(COUNTIF(Treatment Quality for Output type, FALSE) = 0, " Treatment Quality Passed ", "Treatment Quality Failed")
State, Plant ULB
NA
NA
NA
NA
8
Treatment Quality Plants
Treatment Quality Failed
NA
Treatment quality is considered failed when 1 or more parameters of Biosolids or Effluents are not as per benchmarks for the output of the Treatment Process in the last test recorded.
NA
NA
NA
Count of Plants with Treatment Quality Failed
Count (Distinct PlantID) - Treatment Quality Passed
State, Plant ULB
NA
NA
NA
NA
9
Treatment Quality Plants
NA
NA
NA
Map
NA
NA
Point = Geolocation of Plant Plant Icon Colour - Green if Treatment Quality Passed, Red if Treatment Quality Failed
State, Plant ULB
NA
NA
NA
NA
Name of Plant
10
Treatment Quality Plants
NA
NA
NA
Table
NA
NA
NA
Plant Name, Test Result, Compliance %
Test Result Same as S.No 7 and S.No 8
State, Plant ULB
NA
NA
NA
NA
11
Treatment Quality Plants
NA
NA
NA
Table
NA
NA
NA
Stage, Output Type, Parameters 1...n, Compliance %
Mentioned above
State, Plant ULB
NA
Compliance %
% from last month
NA
12
Trend in [Parameter Name] Readings
NA
NA
NA
Multi-Line Chart
Test Dates
Parameter Value
- Value of Device Reading - Value of Lab results
NA
NA
Plant
NA
NA
NA
NA
Date Lab result - X Device Reading - Y
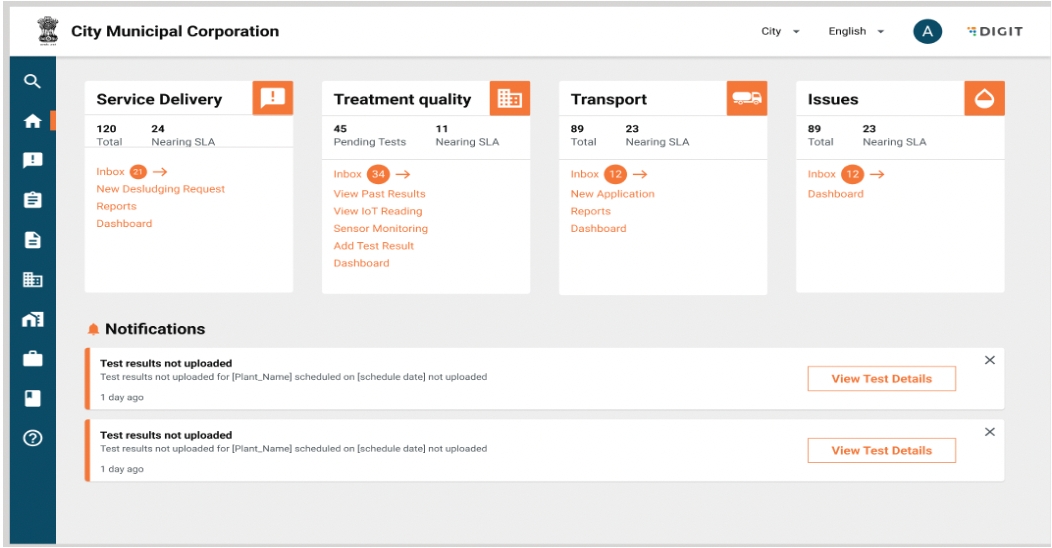
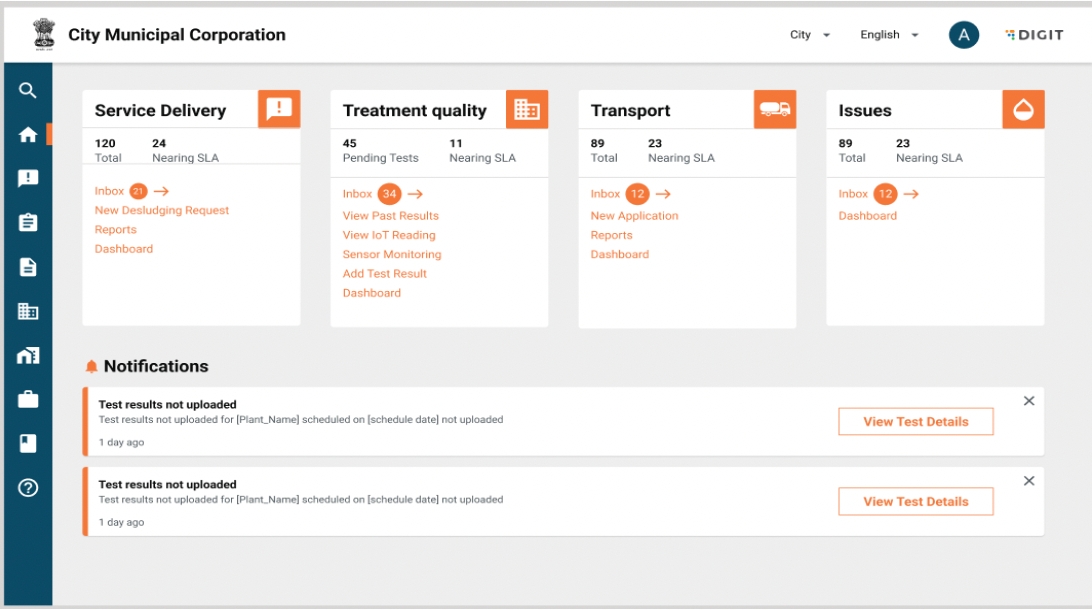
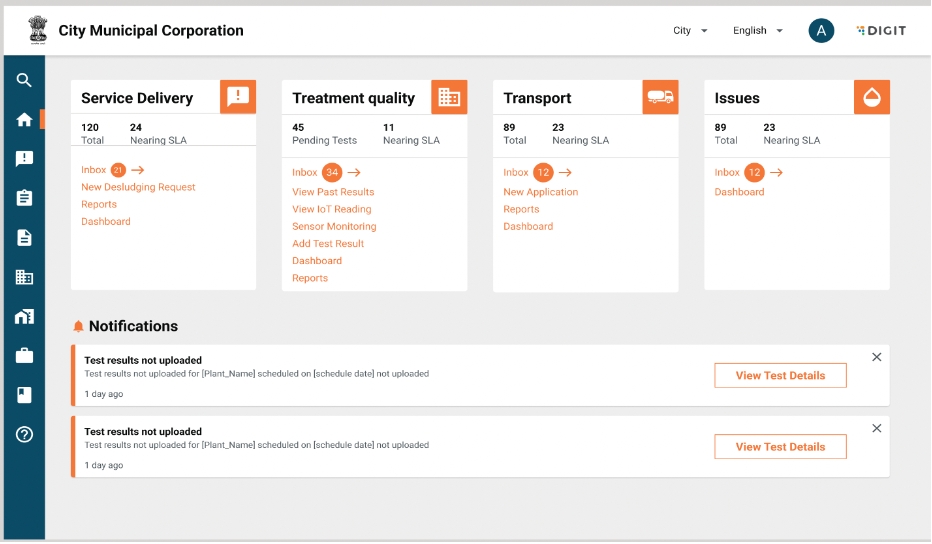
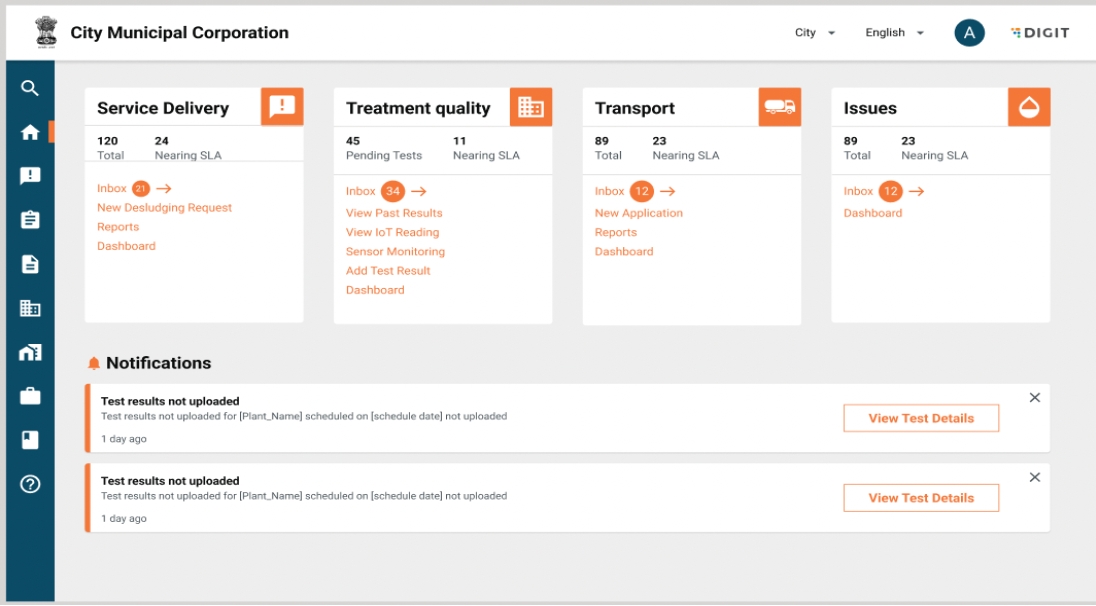
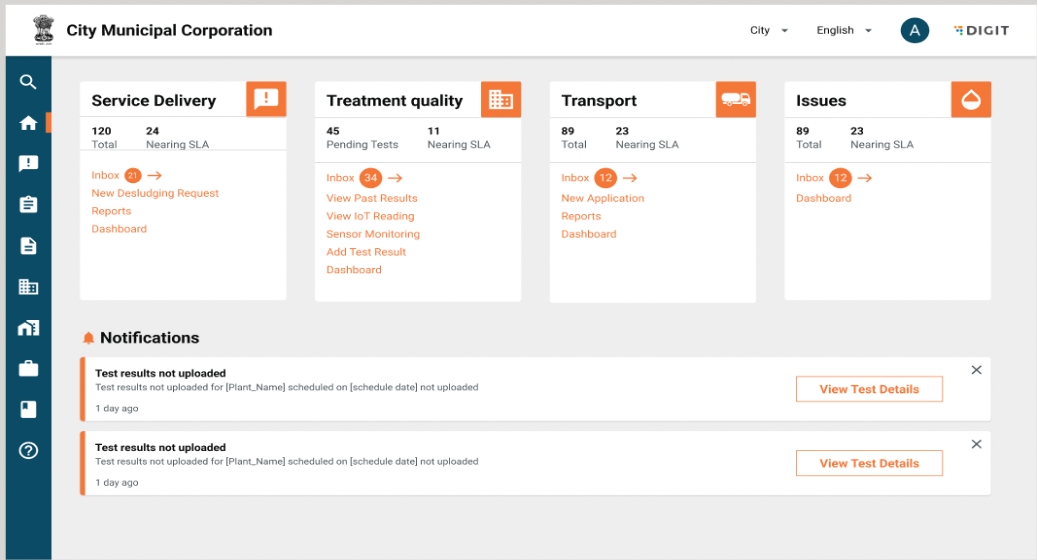
Landing Page: ULB Employee
A card for Treatment Quality Monitoring will be made available on the landing page of the employee.
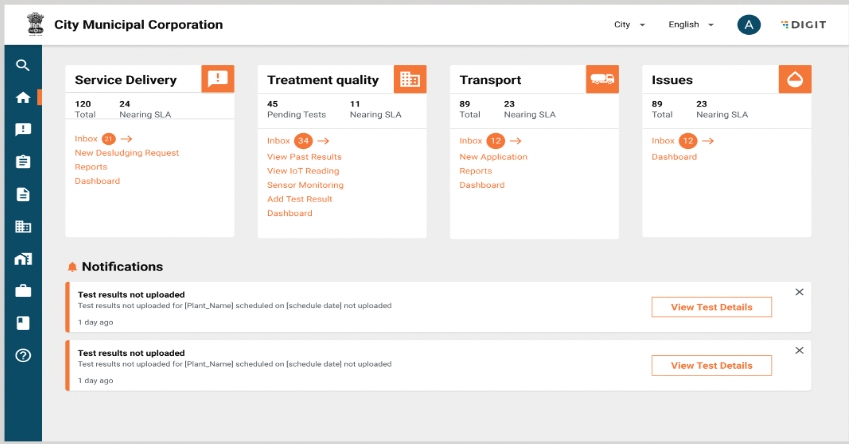
The treatment quality contain the following:
a. An overview of the total pending tests and how many are nearing SLA.
b. View upcoming tests using the inbox. The inbox will show a count of upcoming tests beside in brackets.
c. View past test results: Past results from both lab and IoT devices will be displayed here.
d. View IoT readings: The user can access the record of IoT readings here.
e. Sensor monitoring: The user can access a list of IoT devices along with their status here.
f. View dashboard: The user will be directed to the treatment quality dashboard.
Clicking on each of these links will take the user to the specific page.
Notifications: This will show the list of alerts regarding TQM. Currently, this will display the tests that have crossed SLA for greater than 7 days. The user can view the details of the test by clicking on the “View Details” button. The user can dismiss the notification by clicking on the cross button.
Rest of the functionality will remain the same as the current ULB employee landing page.
View List of Upcoming Tests
On clicking on Inbox, the user is redirected to the list of upcoming tests. This will show only a list of lab tests. The user can perform the following tasks:
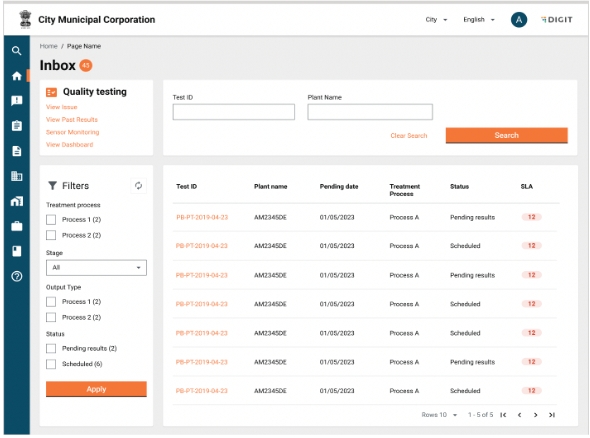
The total count of upcoming tests are displayed beside the inbox in brackets.
View a list of upcoming tests. The list of upcoming tests will be sorted by the pending date, where the test with the highest SLA is displayed first. The following fields will be displayed:
a. Test ID
b. Plant Name
c. Treatment Process
d. Pending Date: This is the test date as per schedule
e. Status: Status of the test
f. SLA: Show difference between test due date and today. This will be displayed in red if test due date<today and in green if today>test due date.
The user can view test details by clicking on the test ID.
Filter tests: Filters are displayed on the left hand panel of the screen. The following filters are available:
i. Treatment process: This will be multi-select showing values for the treatment processes configured for the ULB. The selected treatment process will be displayed as a tick on the multi-select box. If not, it is left blank.
ii. Stages: This will be a dropdown showing values for stages configured for the plant. The selected stage is displayed here on selection. If not, the field is left blank.
iii. Status: This will be a multi-select showing values for the status in the treatment quality workflow.
On selecting values for filters above, the user can click on filter to filter the inbox. To clear filters, the user can click on the refresh icon on the top right of the filter panel.
Sort: Tests can be sorted by the pending date by clicking on the date column.
Search:
a. Tests can be searched using the following:
i. Test ID.
ii. Plant Name.
b. Part search to be enabled for both.
c. Users can fill either test ID or plant or both and click on the search button.
d. Users can clear search by clicking on the clear search link.
In case filters/sort/search is applied and the user navigates to the test details page, on going back, the values of the filters/sort/search should remain the same.
Redirecting to other links in the TQM module: Users can redirect to other pages in the TQM module via the links provided on the top left of the page. The following links will be displayed:
a. View Past Results
b. View IoT Results
c. Sensor Monitoring
d. View Dashboard
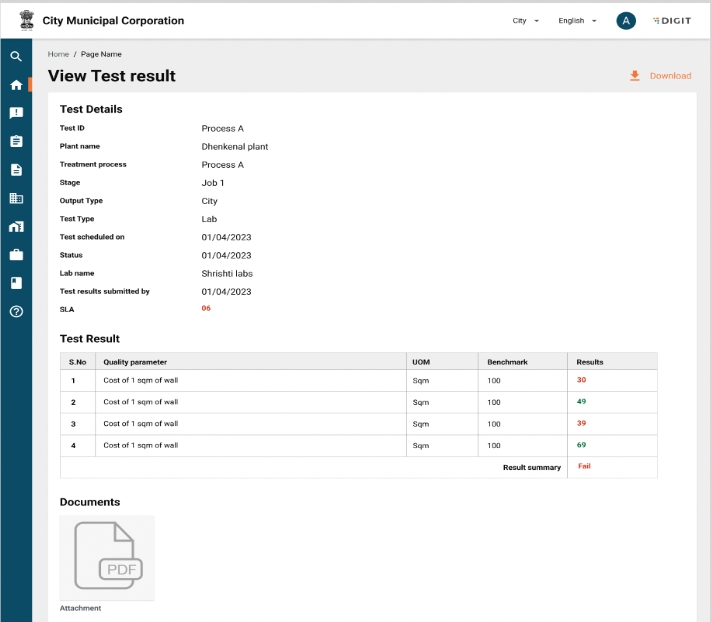
View Test Details
A test details page can be accessed by clicking on the test ID in the inbox. The test details page will consist of the following fields:
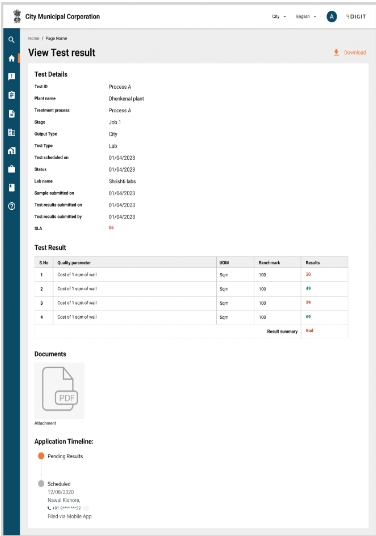
The following information will be displayed. In case the information on any field is not available such as the lab name/value against parameters based on the status of the test, the value against the fields will be displayed as “To be Updated”
- Test ID
- Plant Name
- Treatment Process
- Stage
- Output Type
- Test Type
- Test Scheduled on
- Status
- Lab Name
- Sample submitted on
- Test results submitted on
- SLA (This will be displayed in red/green based on the SLA. If today>pending date, this is red, If today<pending date, then green for open tests. For closed tests, SLA will be displayed).
- Table containing the following details:
i. S.No
ii. Parameter
iii. UoM
iv. Benchmark
v. Value Recorded - The value will be displayed in red/green based on comparison to the benchmark
vi. Overall Test results - Pass/Fail
- Attached documents, if any. The user should be able to view the document by clicking on the document icon. No icon will be present if documents are not attached.
- Test Timeline
The user can go back using the breadcrumbs of the page.
The user can download the test report by clicking on the 'Download' button.
View Past Test Results
Past test results (both IoT and Lab) can be viewed via the TQM landing page and clicking on past tests.
On clicking on past test results, the user is redirected to the list of past tests.
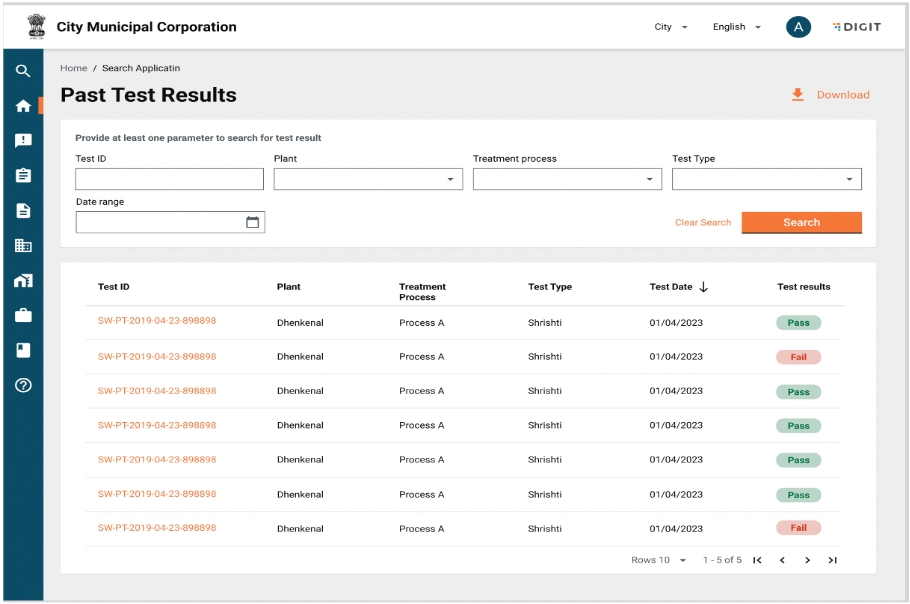
The user can perform the following tasks:
View the list of past tests. The results will be sorted on the test date. The following will be the fields displayed:
a. Test ID
b. Plant
c. Treatment Process (in case the there is only 1 treatment process for the plant, this field will not be displayed).
d. Test Type
e. Test Date: This is the date the test results are updated
f. Test Result: Pass/Fail
View test details: The user can view test details by clicking on the “Test ID” link in each row.
Search tests: The user can search based on the following:
i Test ID: Input text field, part search should be enabled.
ii. Plant: Dropdown of list of plants in the ULB.
iii. Treatment process: Dropdown of list oftTreatment Process in the ULB.
iv. Test type: This will be a dropdown showing values for the test type (IoT/Lab). The selected test type is displayed here on selection. If not, the field is left blank.
v. Date range: Selection of date range (calendar view): The selected date range is displayed here on selection. If not, the field is left blank.
On selecting values for search above, the user can click on search to filter the inbox. To clear search and view all past tests, the user can click on “Clear Search”.
Sort: Tests can be sorted by the pending date by clicking on the date column.
In case filters/sort/search is applied and the user navigates to the test details page, on going back, the values of the filters/sort/search should remain the same.
Download test results in Excel and PDF formats using the download button.
The user can go back using the breadcrumbs on the top of the page. In case the user has navigated to the test details page from the past test results list, on clicking back, the user should be redirected to the test details page.
On clicking on any test ID button, the user will be redirected to the test details page (same as redirection from the inbox).
View IoT Readings
IoT readings can be viewed via the TQM landing page and clicking on “View IoT Reading”.
On clicking on IoT readings, the user is redirected to the list of past tests, with the search on test type selected as IoT and the results filtered for IoT readings only. All other functionality will remain the same.
Sensor Monitoring
The list of devices can be viewed via the TQM landing page and by clicking on ‘Sensor Monitoring’’.
On clicking on sensor monitoring, the user is redirected to the list of devices.
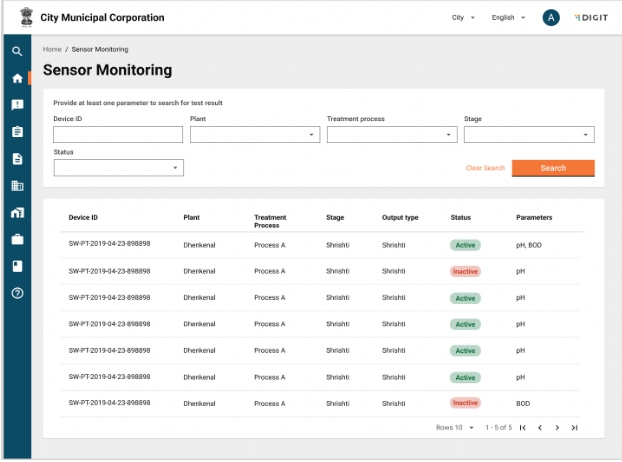
The user can perform the following:
View total devices: The total number of IoT devices is displayed beside the page heading in brackets.
A row is available for each device. The following details will be displayed:
- Device ID
- Plant
- Treatment Process
- Stage
- Output Type
- Device Status
- Parameters: One or multiple parameters that the device is monitoring.
The user can perform the following actions:
a. Search Devices: On clicking on the filter, a pop up will be displayed. The following filters are available:
Device ID: Part search should be available here.
Plant: Dropdown based on plants configured in the MDMS.
Treatment process: Dropdown-based on the treatment process type.
Stage: Dropdown-based stage of selected treatment process.
Output type: This will be a drop down showing values for Output types configured for the plant.
Device status: Dropdown contains active/Inactive as options.
b. On selecting values for filters above, the user can click on Search to filter the inbox.
c. To clear search, the user can click on clear all.
Record Test Result
Since actors such as PCB might conduct adhoc tests, a provision will be provided to the user to record test results without a schedule. A user can record test results by clicking on the “Add Test Result” link on the card.
Clicking on the “Add Test Result” button will redirect the user to the “Add Test Result” page.
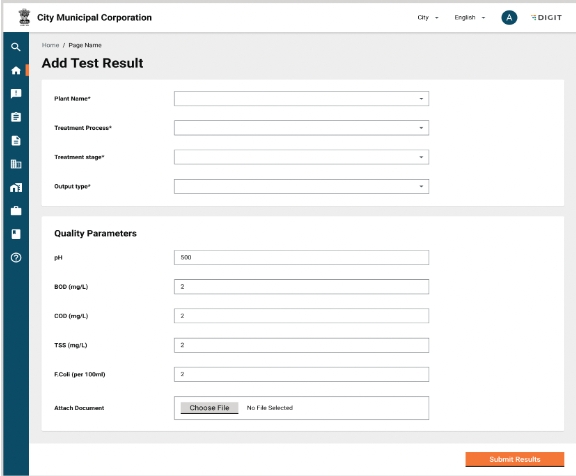
The following fields need to be entered by the user:
Plant Name: This is a dropdown based on the list of plants available in the system. For a state level user, this should display all plants in the state. For a ULB, it should also display the names tagged to the ULB.
Treatment Process: This is a dropdown based on the list of treatment processes in the plant selected.
Treatment Stage: This is a dropdown based on the list of stages in the treatment process selected.
Output Type: This is a dropdown based on the output types available in the stage
Values against parameters. Atlease 1 parameter needs to be filled for the submit button to be enabled. If no parameter is filled and the user clicks on the submit button, an error message is displayed as a snack bar.
Attachments, if any.
Once the user clicks on the Submit button, the test results page is displayed.
This is the same as the “View Test Results” page with the following changes:
TesttType will be displayed as Lab.
Status, lab name and SLA field are not displayed.
Workflow will not be displayed.
The user can go back to the “Add Test Results” page via the breadcrumbs.
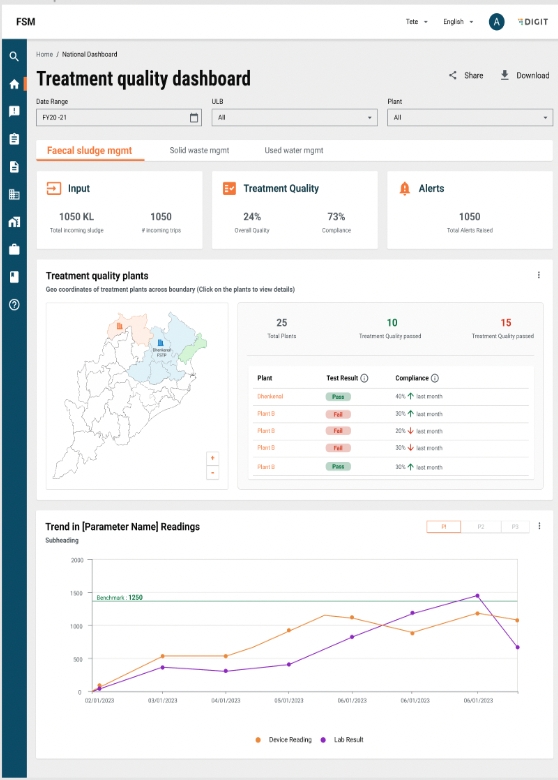
View Dashboard
The TQM Dashboard will be made available to both the ULB employee and the state employee, and can be accessed by clicking on the dashboard link on the landing page.
On clicking on the dashboard, the user is directed to the dashboard view.
The access to data in the dashboard will be based on the following roles:
ULB admin will be able to view the dashboard for all plants in the ULB.
A state admin will be able to view the dashboard for all plants in the ULB.
Navigation:
On landing on the dashboard, the user can navigate across the treatment process types to view the dashboard specific to the treatment process type.
Filters:
Date range: Users should be able to filter based on the date range.
ULB: Users should be able to filter based on the ULB. For a ULB employee, the ULB is auto-selected to the ULB the plant and employee is tagged to. For a state user, all ULBs are available.
Plant: Users should be able to filter based on the plant. For ULB employees, plants tagged to the ULB to which the employee belongs should be available in the dropdown. For state users, all plants are available.
Other functionalities:
Share:
- Users should be able to share a filtered dashboard over WhatsApp in an image format.
- Users should be able to share filtered charts/tables over WhatsApp in an image format.
Download:
- Users should be able to download the filtered dashboard in PDF and image formats.
- Users should be able to download the filtered charts/tables in PDF and image formats.
Metrics
Overall KPIs:
The dashboard will display the following KPIs:
Total incoming sludge: The sum of the total sludge that is disposed of at the plant for the selected time period.
Number of trips: A count of total incoming vehicles at the treatment plant for the selected time period.
Overall quality: The number of tests where all parameters are as per benchmarks as compared to the total number of test results recorded.
Compliance percentage: The percentage of tests where results have been recorded
Total alerts: A Count of total alerts raised of the following types: Test results not as per benchmark, the number reading from IoT device, and lab results and IoT results not matching.
Treatment quality overview:
KPIs:
Total plants - A count of the unique plants for the particular treatment process.
Count of plants who have passed the treatment quality as per the last recorded test.
Count of plants who have failed the treatment quality as per the last recorded test.
Treatment quality is said to have passed if all parameters for final output(s) of a treatment process are as per benchmarks. Treatment quality is said to have failed if 1 or more parameters for final output(s) of a treatment process is not as per benchmarks.
Map:
A map view of the location of each plant will be displayed as part of the dashboard. Plants here will be colour coded, based on whether it has passed/failed the treatment quality. (Red = failed, Green = passed).
Table:
A table will be available to plant-wise details of test results (pass/fail), and the compliance percentage. This will be as per the last test result. The user will also be able to see a change in compliance percentage compared to the last month. A drilldown will be made available for a plant via this table. For TRP users and ULBs, where only 1 plant is tagged for the process type, the drilled table is automatically visible.
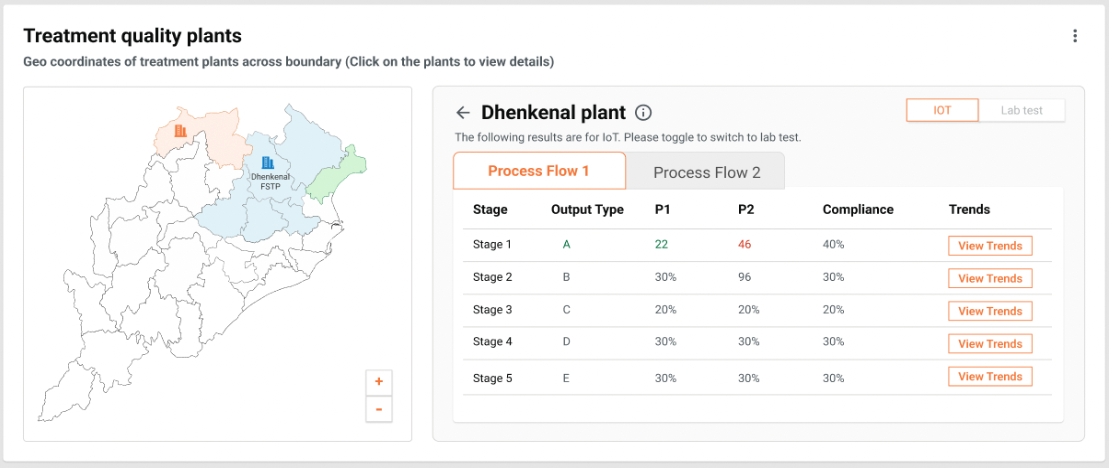
On drilldown, the following is viewable to the user:
Heading - Name of plant.
Table displaying the following fields:
a. Stage, output type, value of parameters, and compliance percentage.
b. Button to view the trends for a particular stage.
Toggle to toggle between IoT readings and lab results.The selected test type will appear highlighted.
If there are multiple process flows, then the user can switch between process flows by using the buttons. The selected process flow will appear highlighted.
Trends of parameter readings:
This chart will be available once the user clicks on the view trend button in the table button.
The table shows the trend for one parameter over time and provides a view of the benchmark for comparison. A toggle is available to navigate between parameters.
Was this helpful?